A C B L TOURNAMENT AND CLUB TABLE DATA

The following table data is unofficial (not directly issued by the ACBL, but compiled from data publicly available on ACBLLive and LIVE4Clubs, as well as the BridgeFinesse site).  Hopefully you will find this useful, or at least interesting, as the webmaster's not infrequent insomnia should be someone's gain.  PLEASE NOTE:  All table count comparisons are year-over-year data from 2025 (to date) to 2024, and are for face-to-face tables only (there are no online tables counted anywhere here).  ACBL's Brass may "not be interested in numbers", but we are here for that party.

TOTAL 2025 TABLES (SO FAR) AND THEIR COMPARISON TO SAME PERIOD IN 2024
ALL OPEN REGIONALS  N=23
 
   ALL OPEN SECTIONALS  N=172
 
   I/N TOURNEYS  N=44
 
LOCAL CLUB TABLES  N=17 wks
 
   N A B C TABLES  N=1


Changes in the average number of tables per type of tournament for 2025 through April 28.

Local ACBL club games are up +2.7%, to 8.12 tables per game; I/N Sectionals are running at 35.9 tables per tournament (up +3.9% from 2024, N=34).  I/N Regionals (N=8) are down -5.7% from the same period in 2024.  Open sectional tournaments averaging 120.6 tables each (N=170) and Open regionals 953.4 (N=21).

A look at Open Sectionals each month and their average tables per tournament compared to the same months in 2024.  Most of these sectionals are repeat performances, but a few held in 2024 were not scheduled this year (and vice versa).  This chart includes all sectional tables during the monthly period (whether held in 2024 or not).

The top line number at the top of this page for Open Sectionals is for total tables - and the chart to your left is the change in average tables per open sectional tournament.  (Thus explaining the discrepancy in numbers, if any, between the top of the page and the top of the chart on your left.)

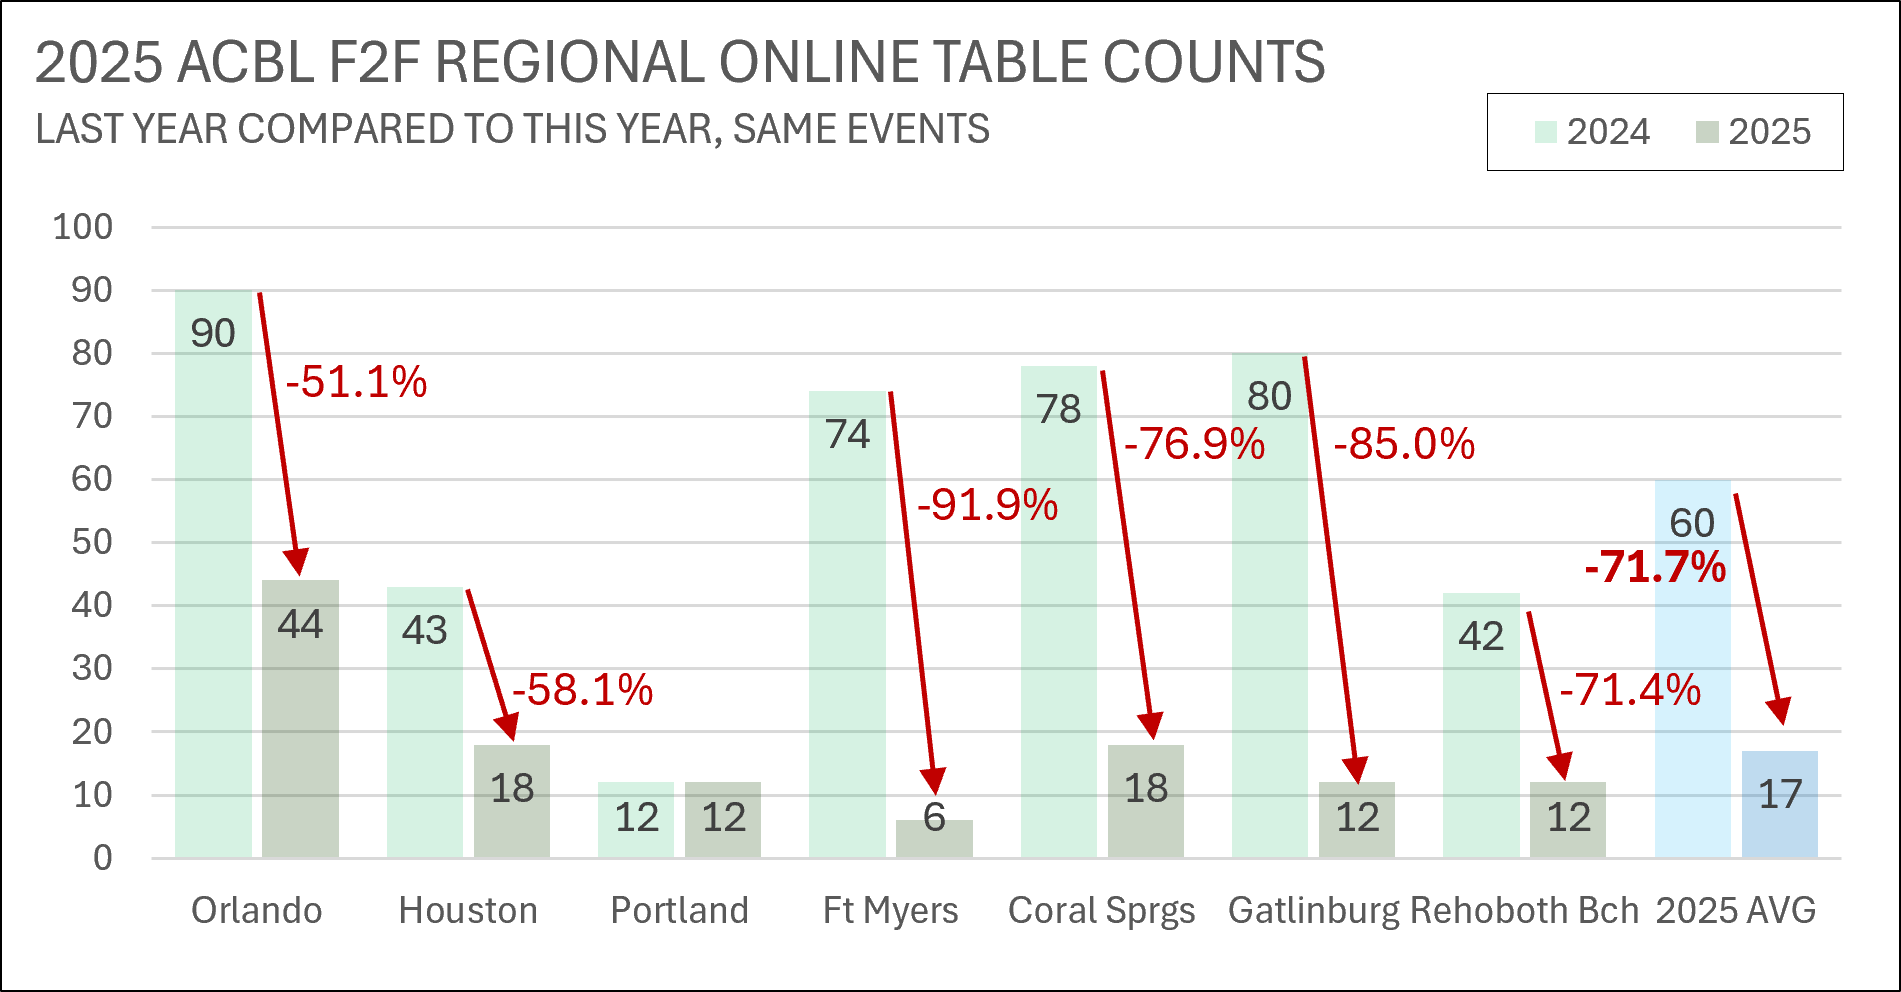
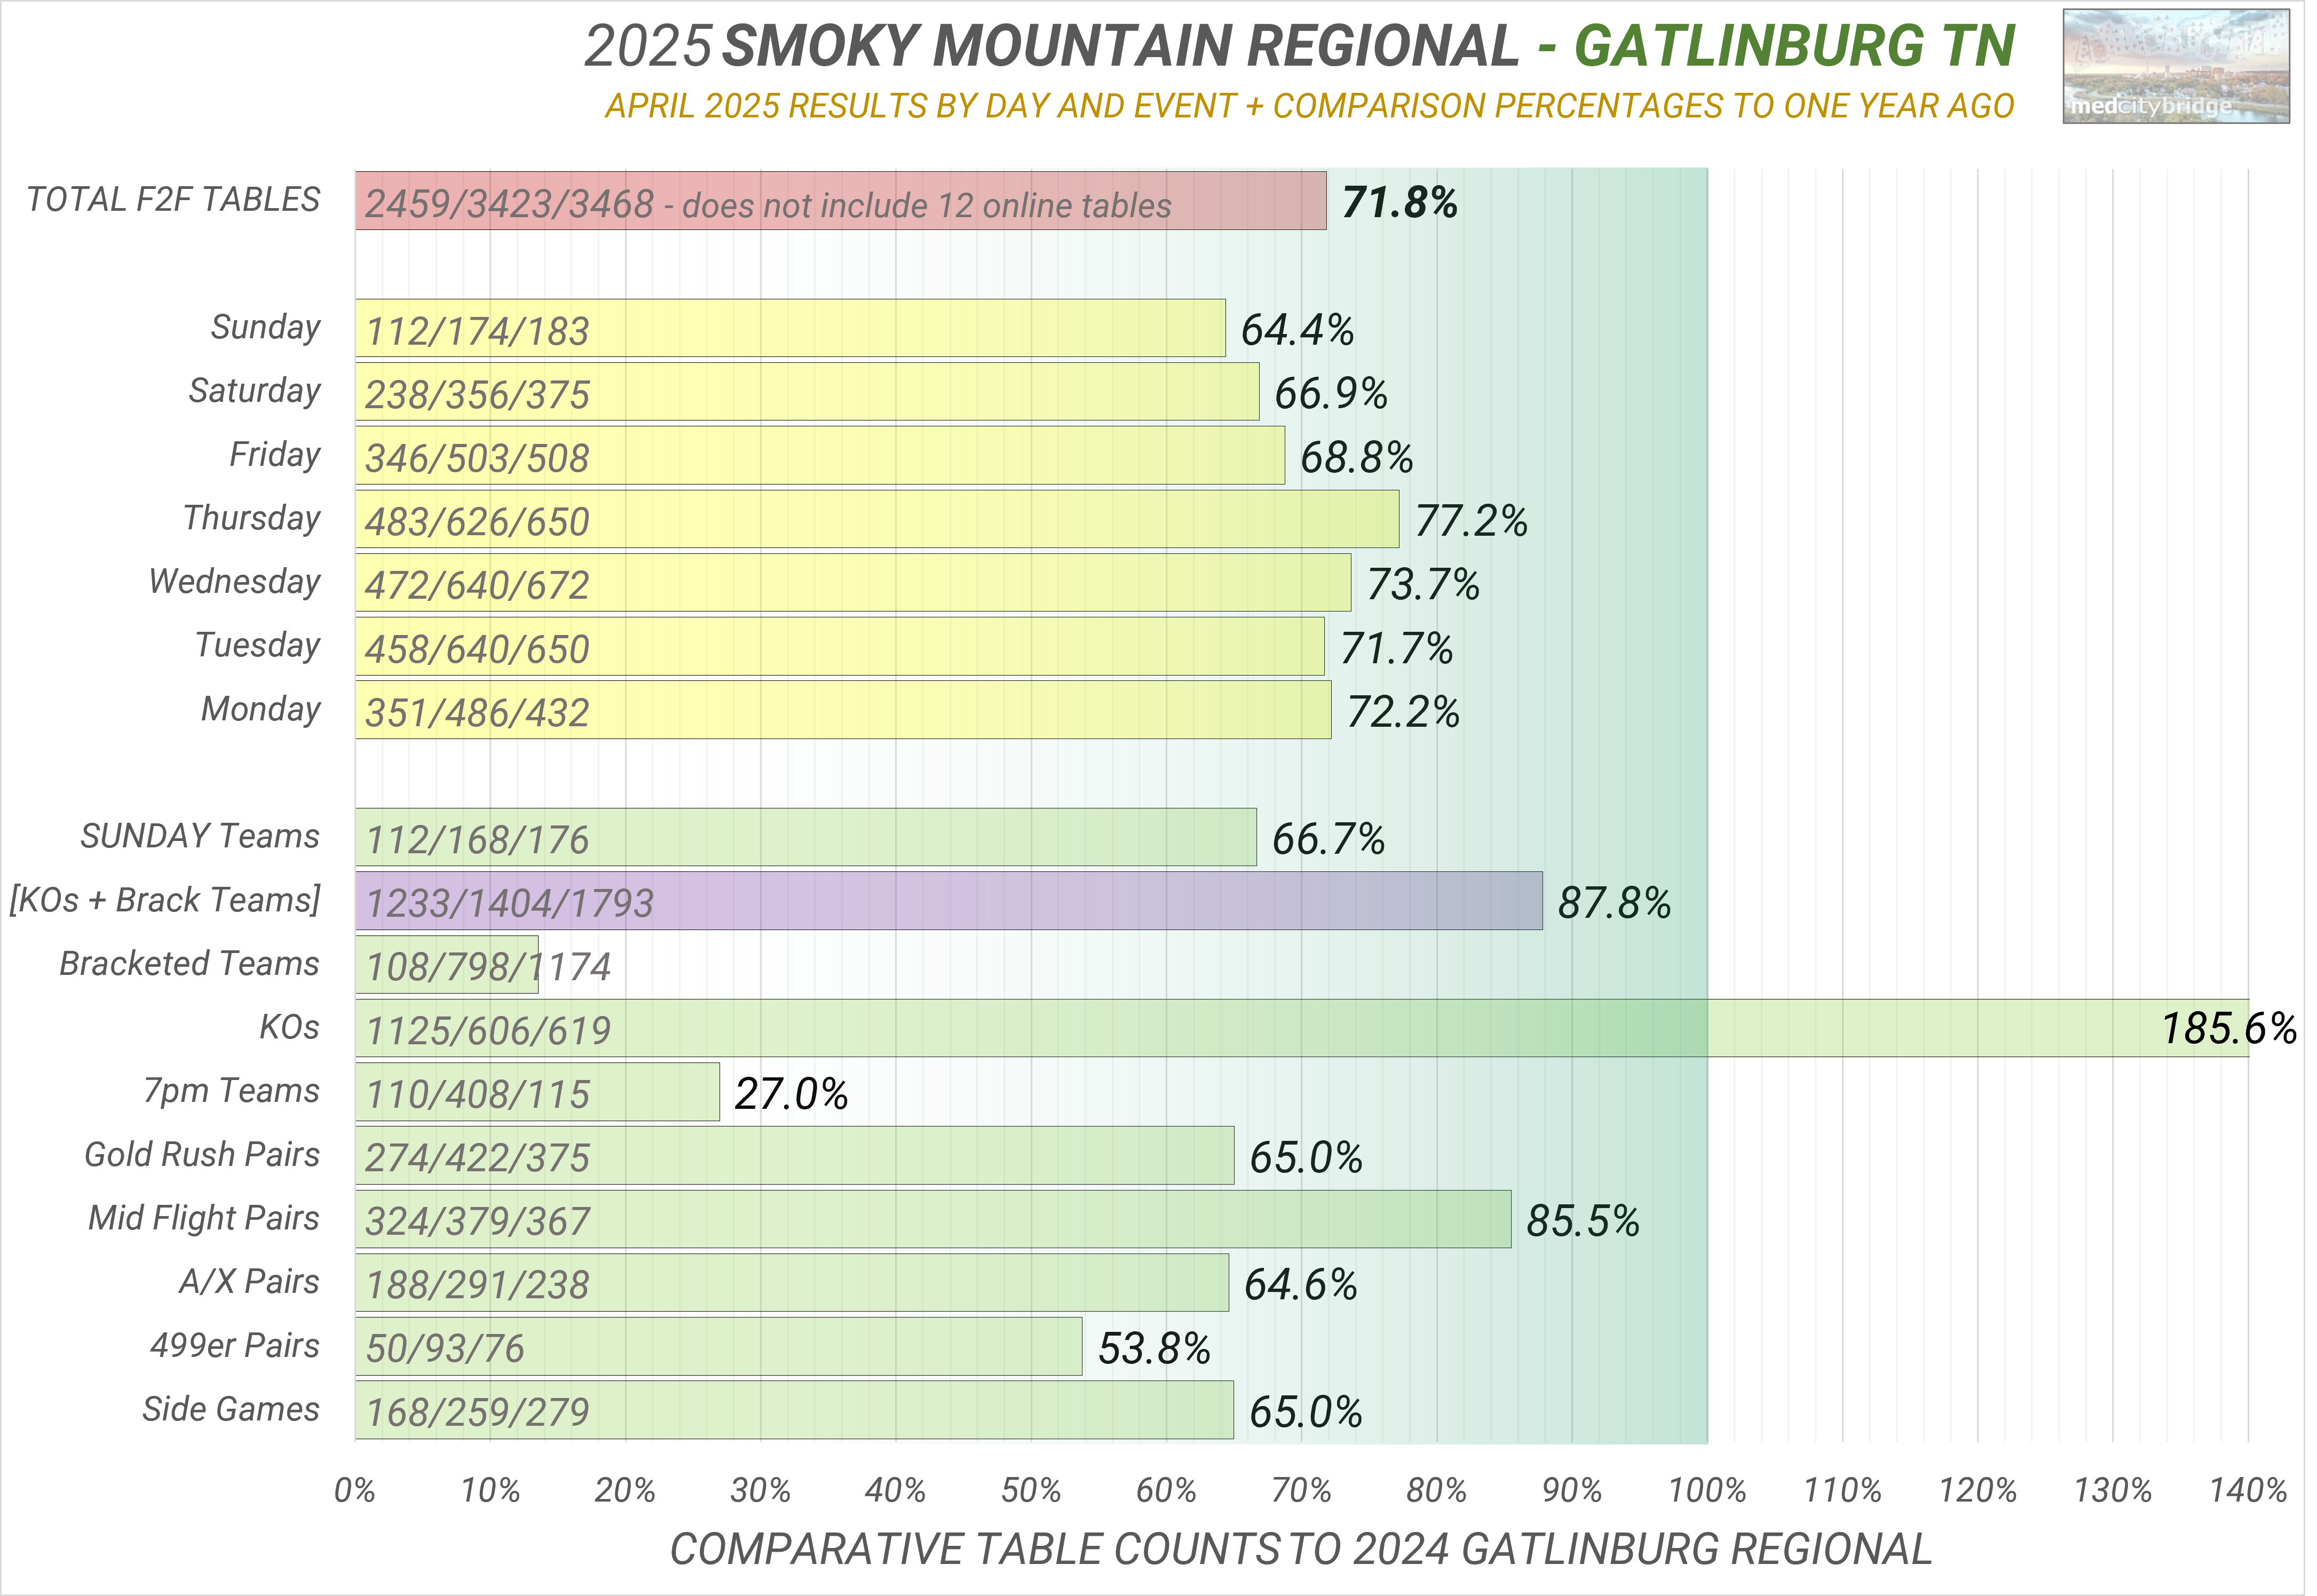
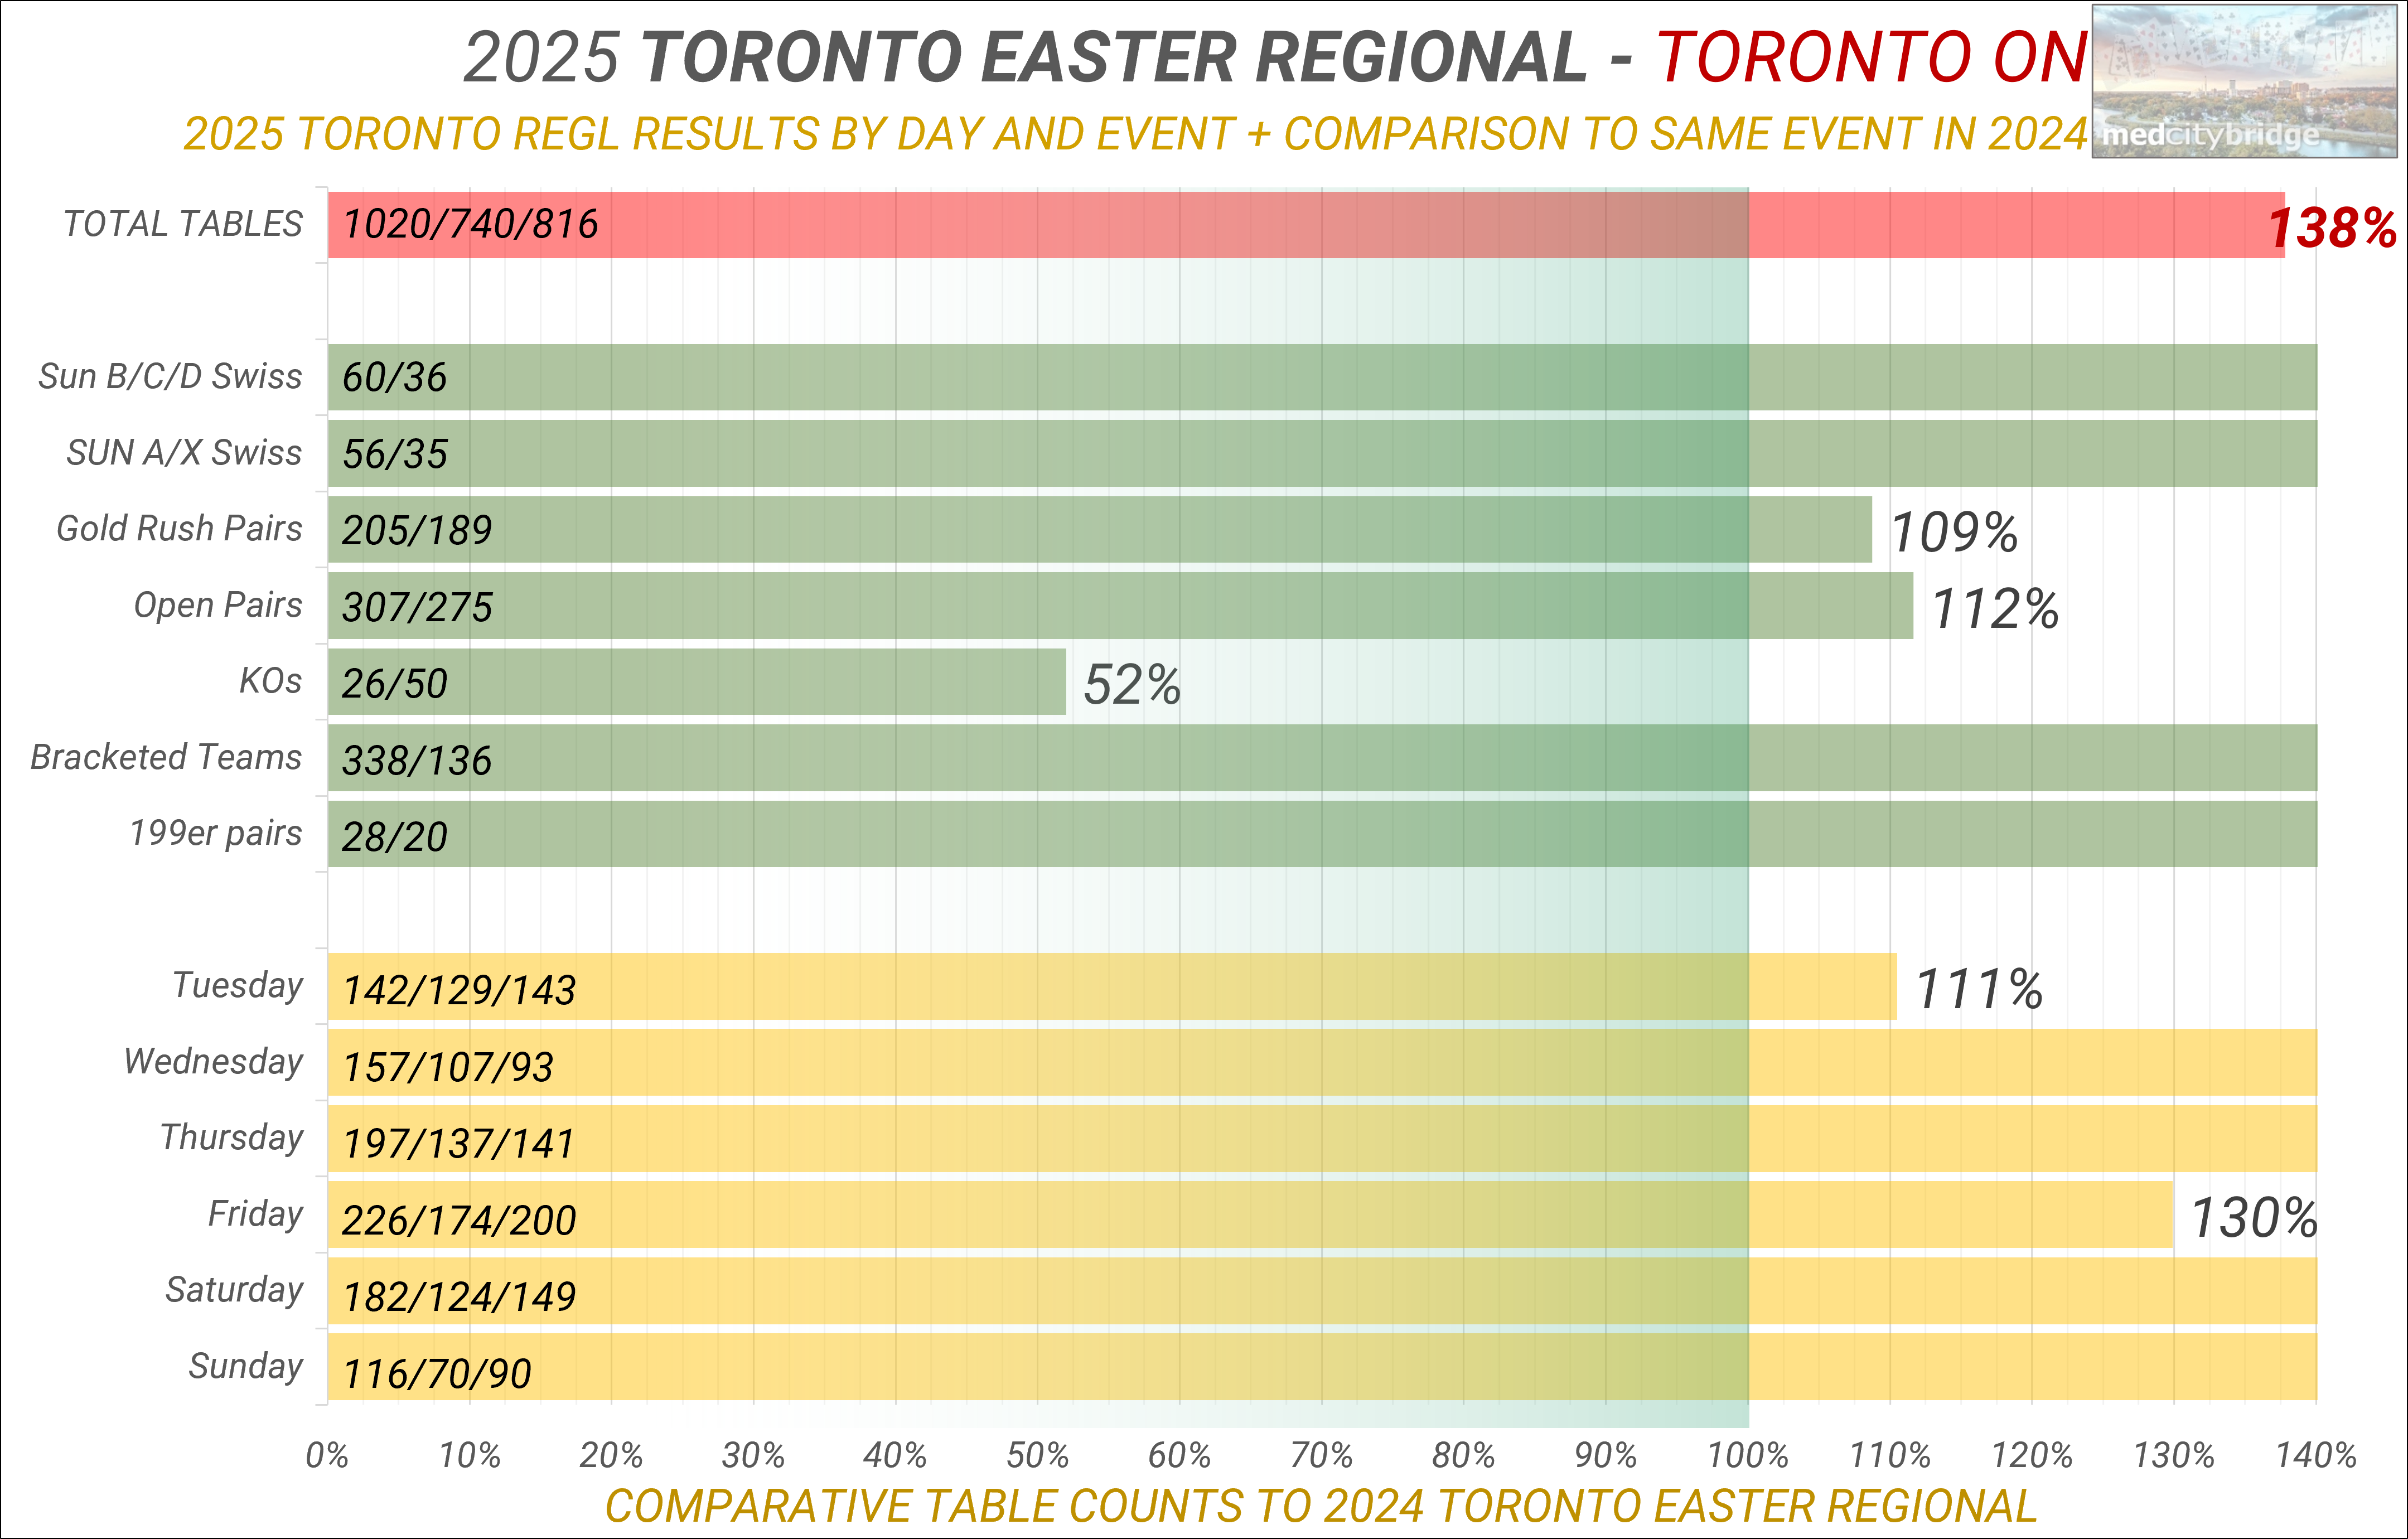
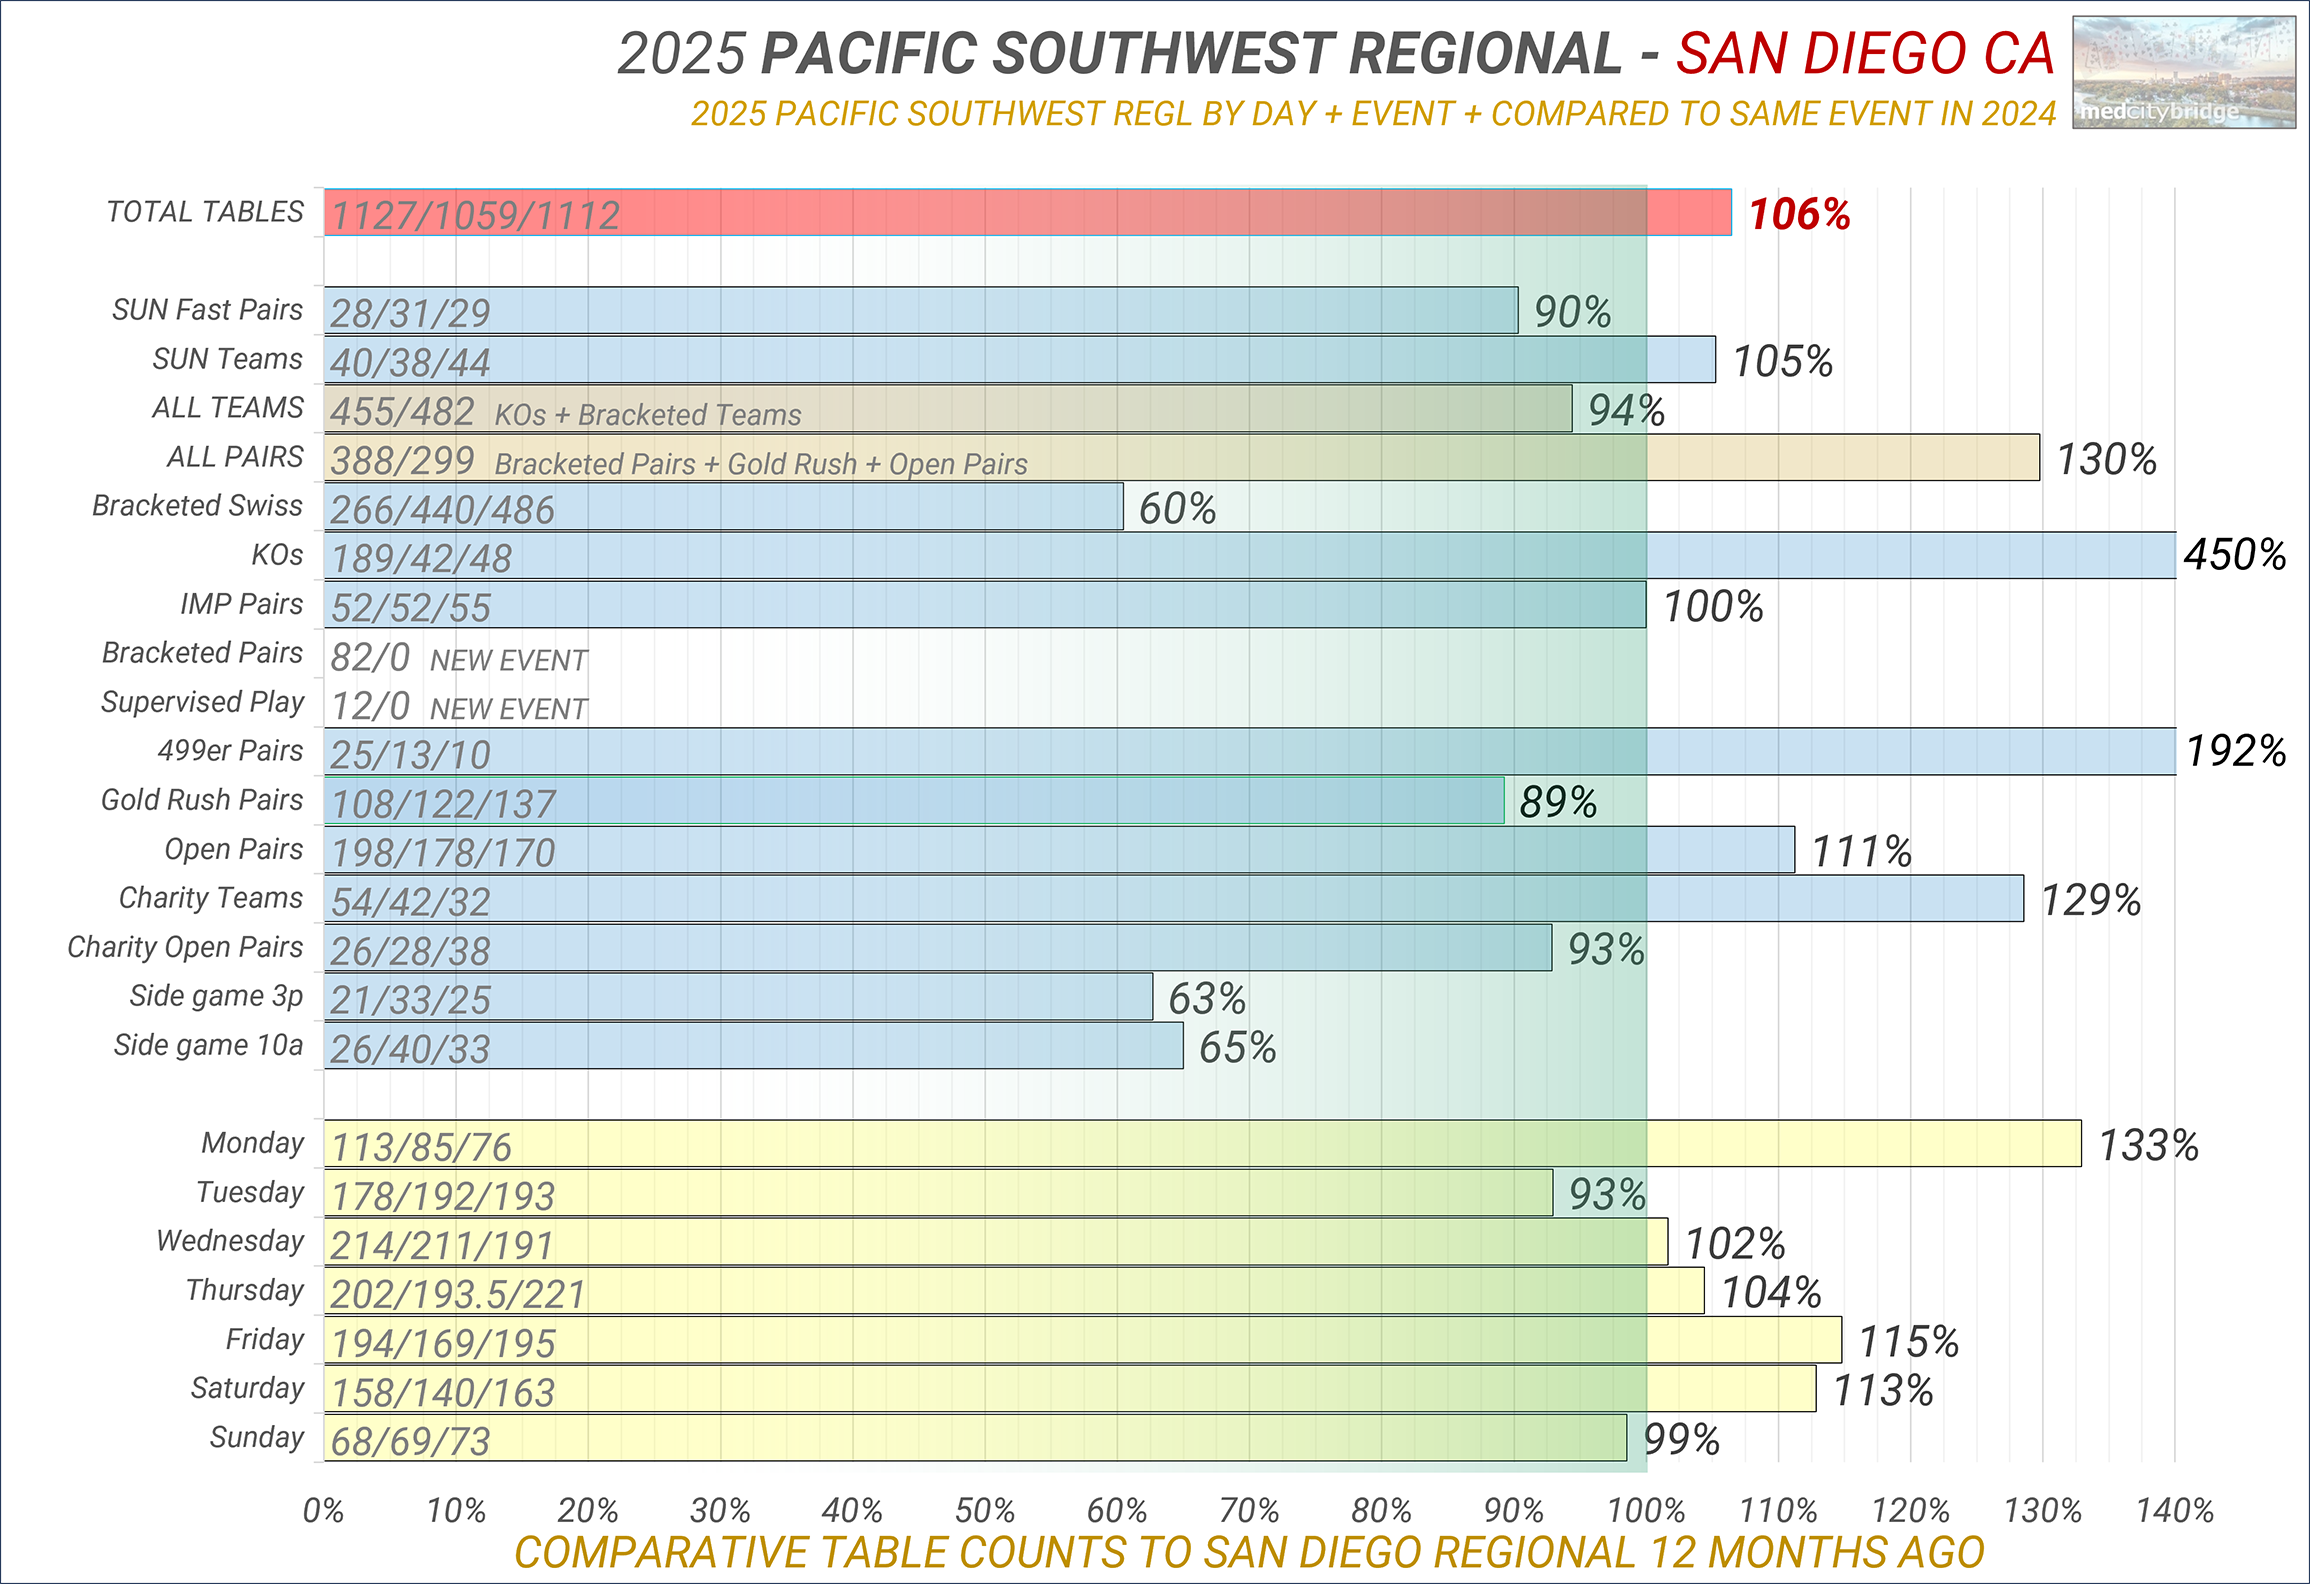
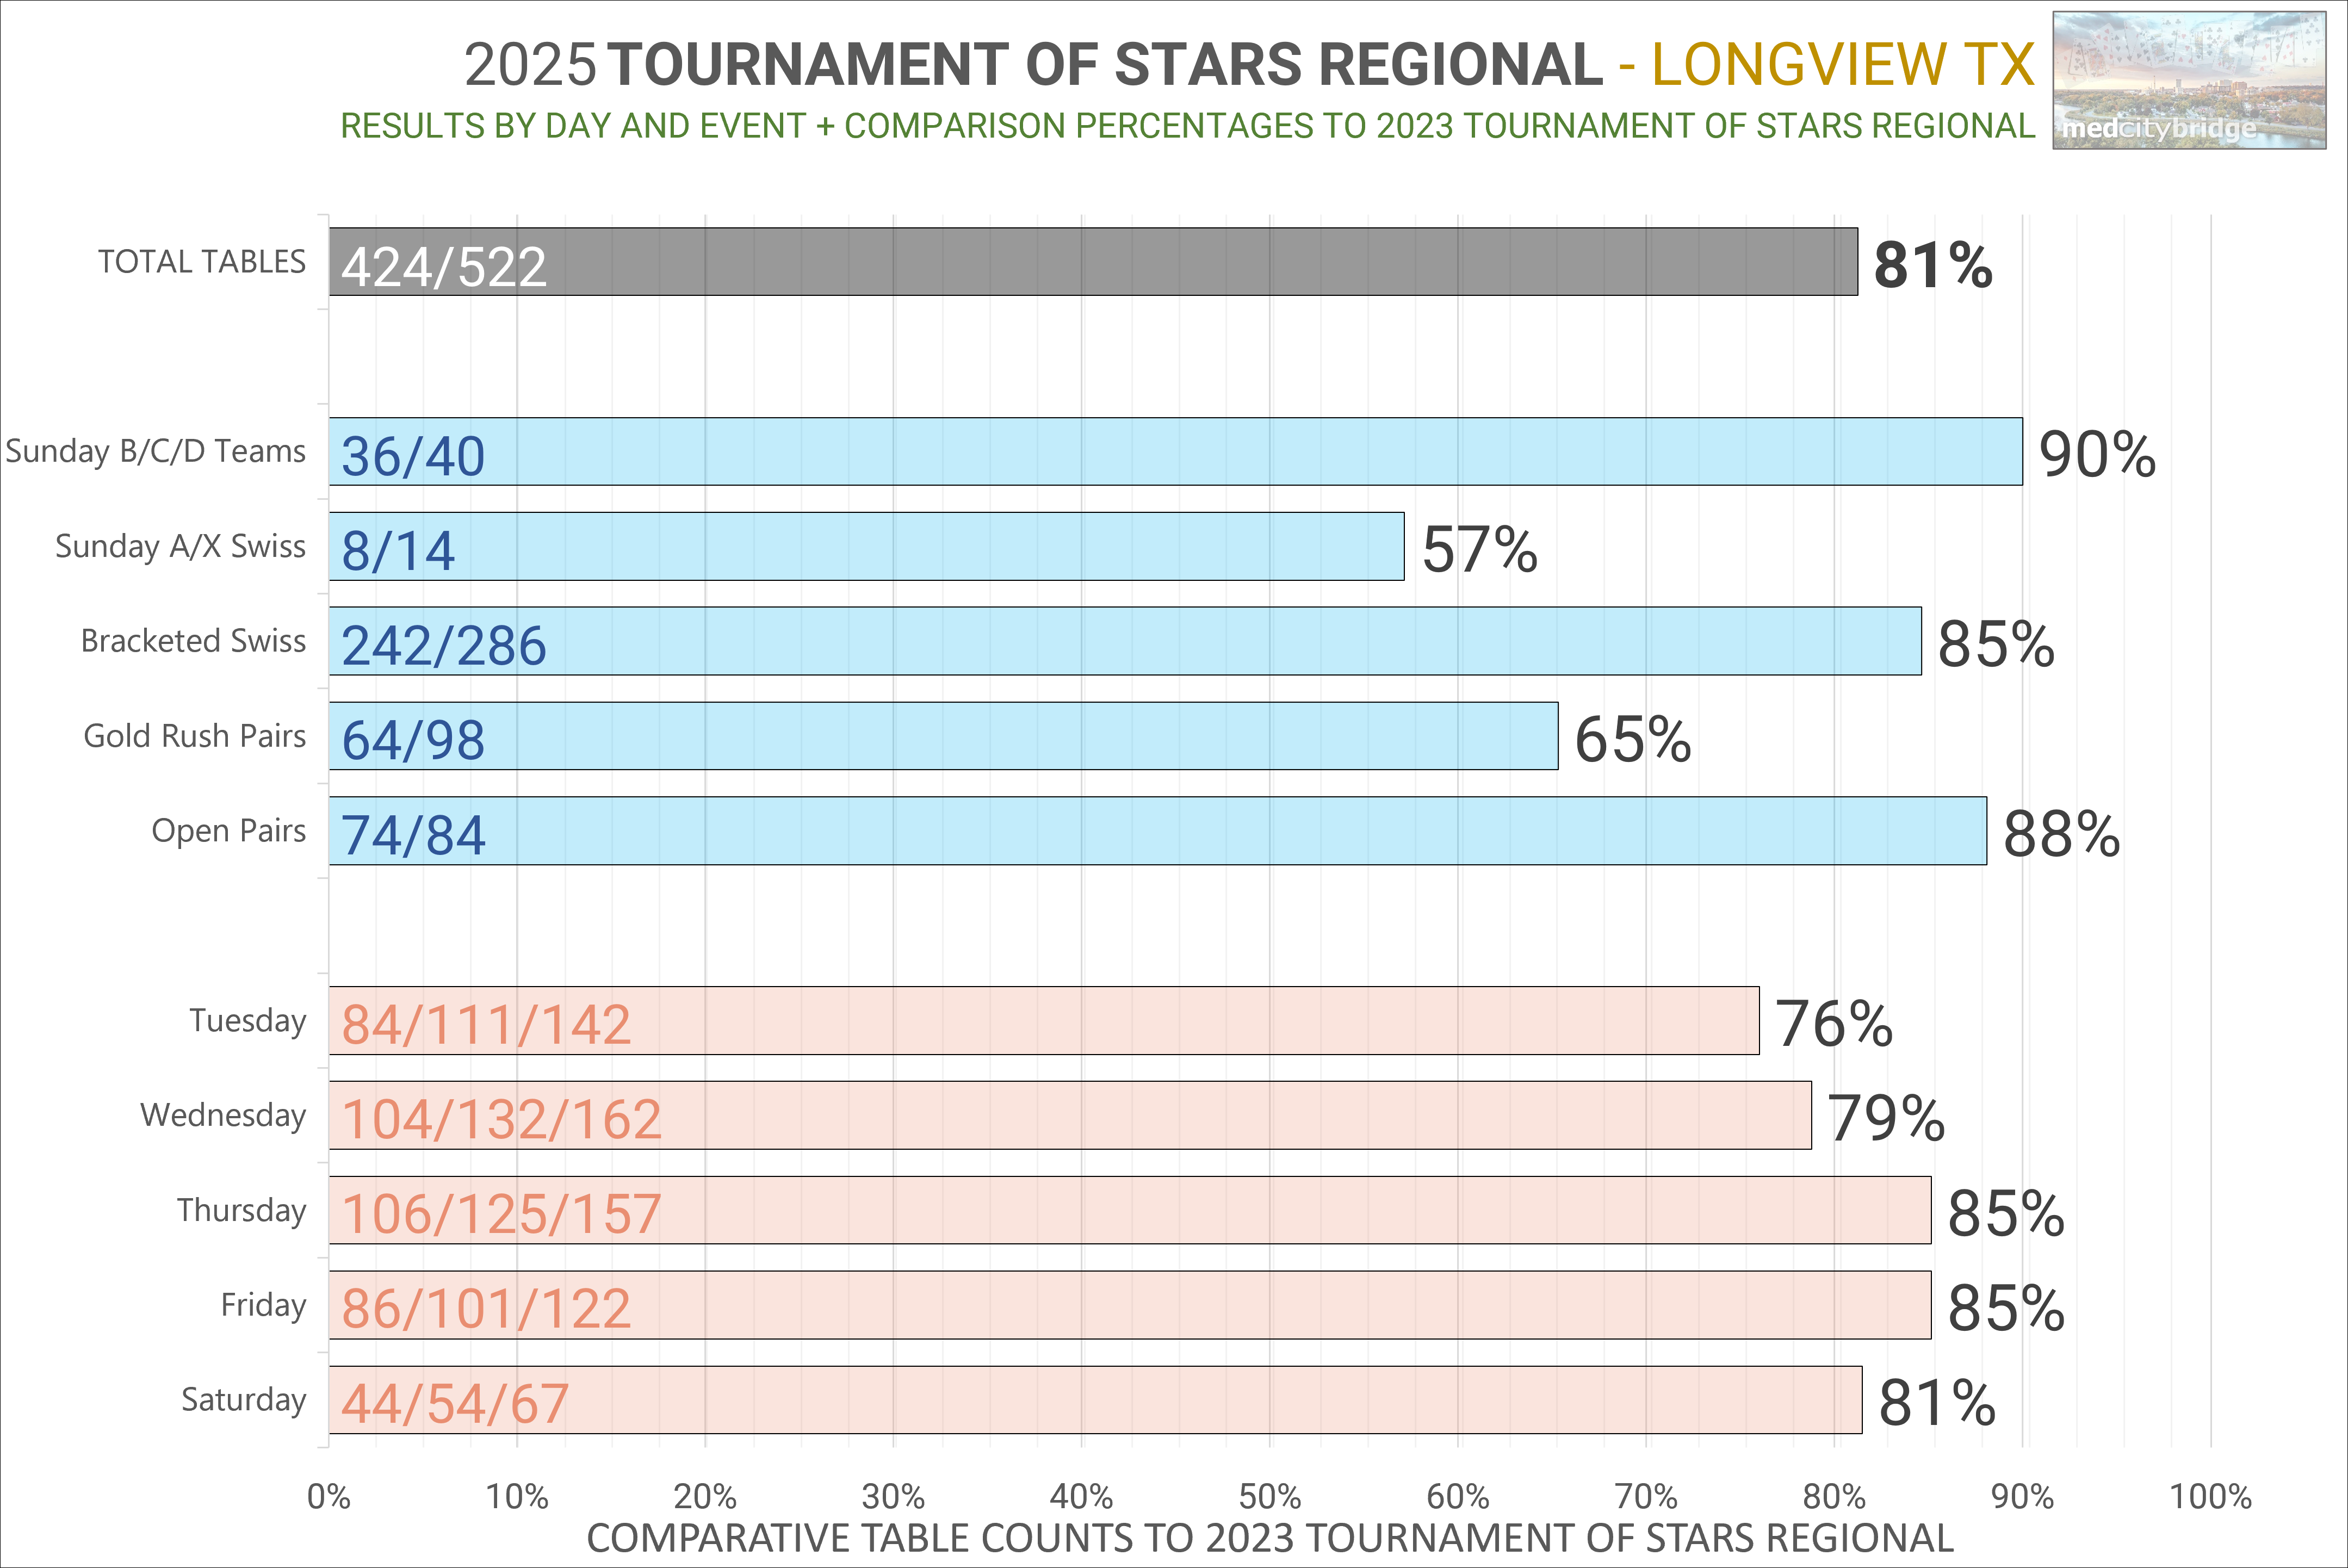
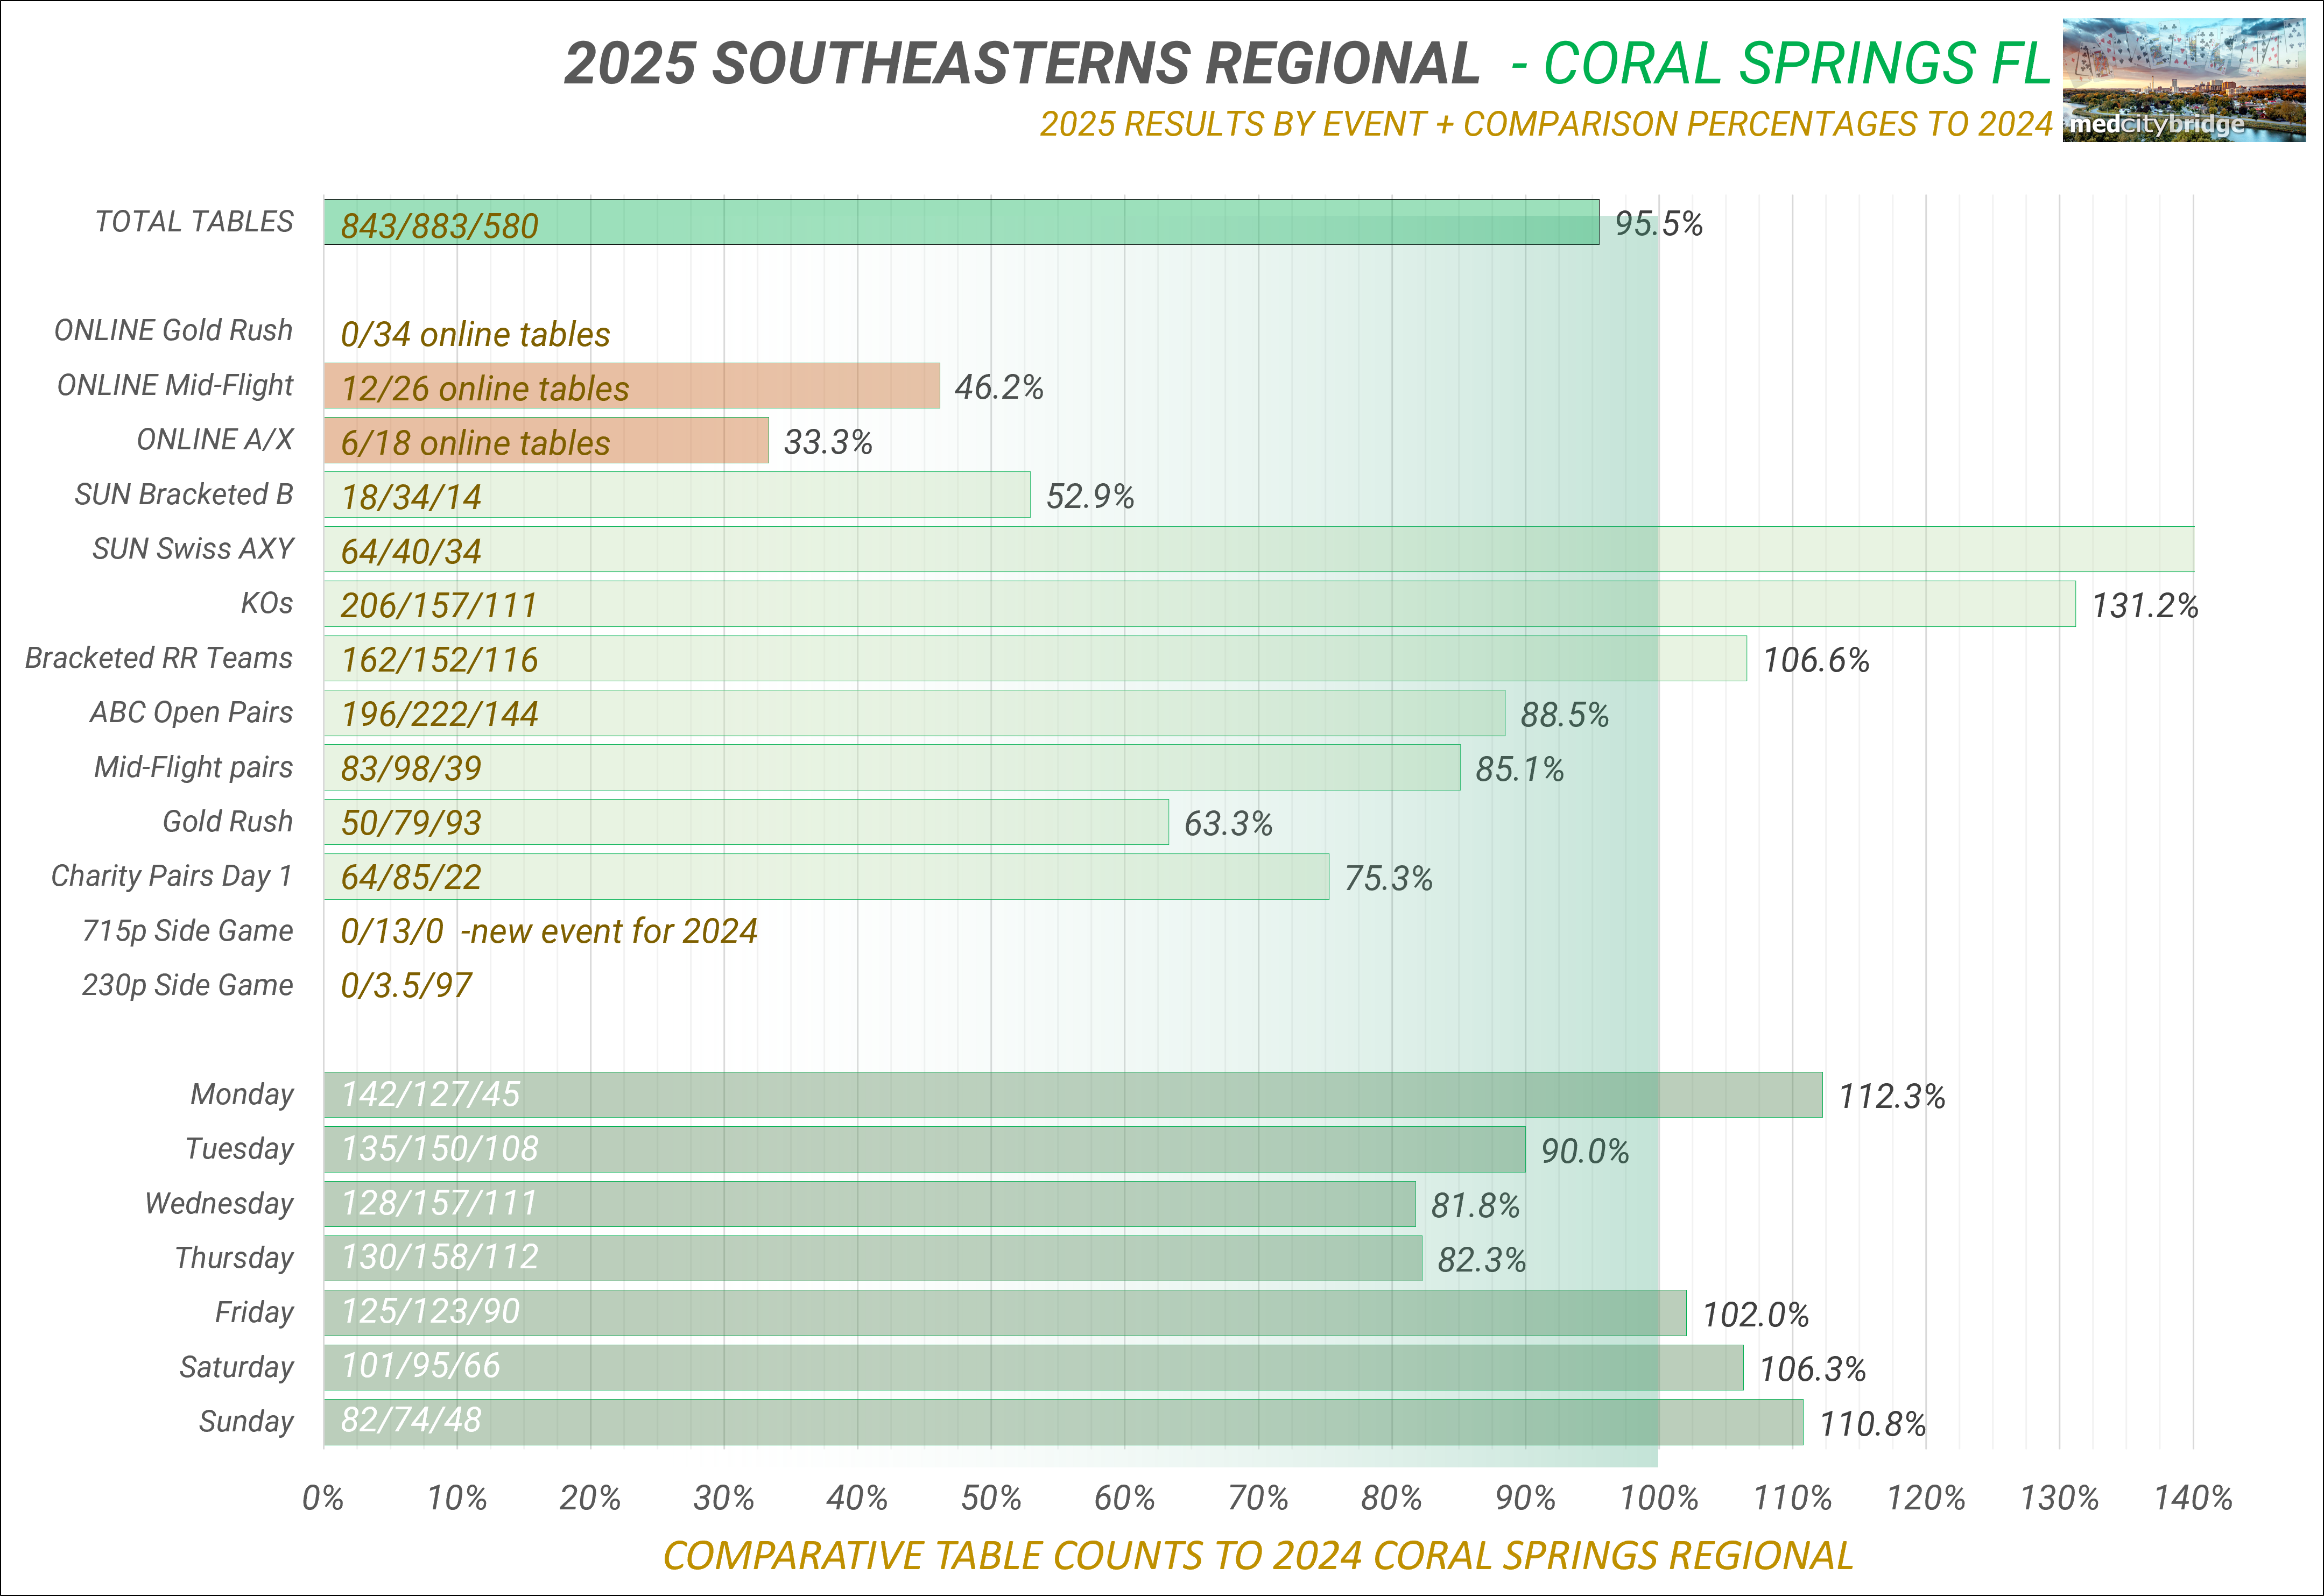
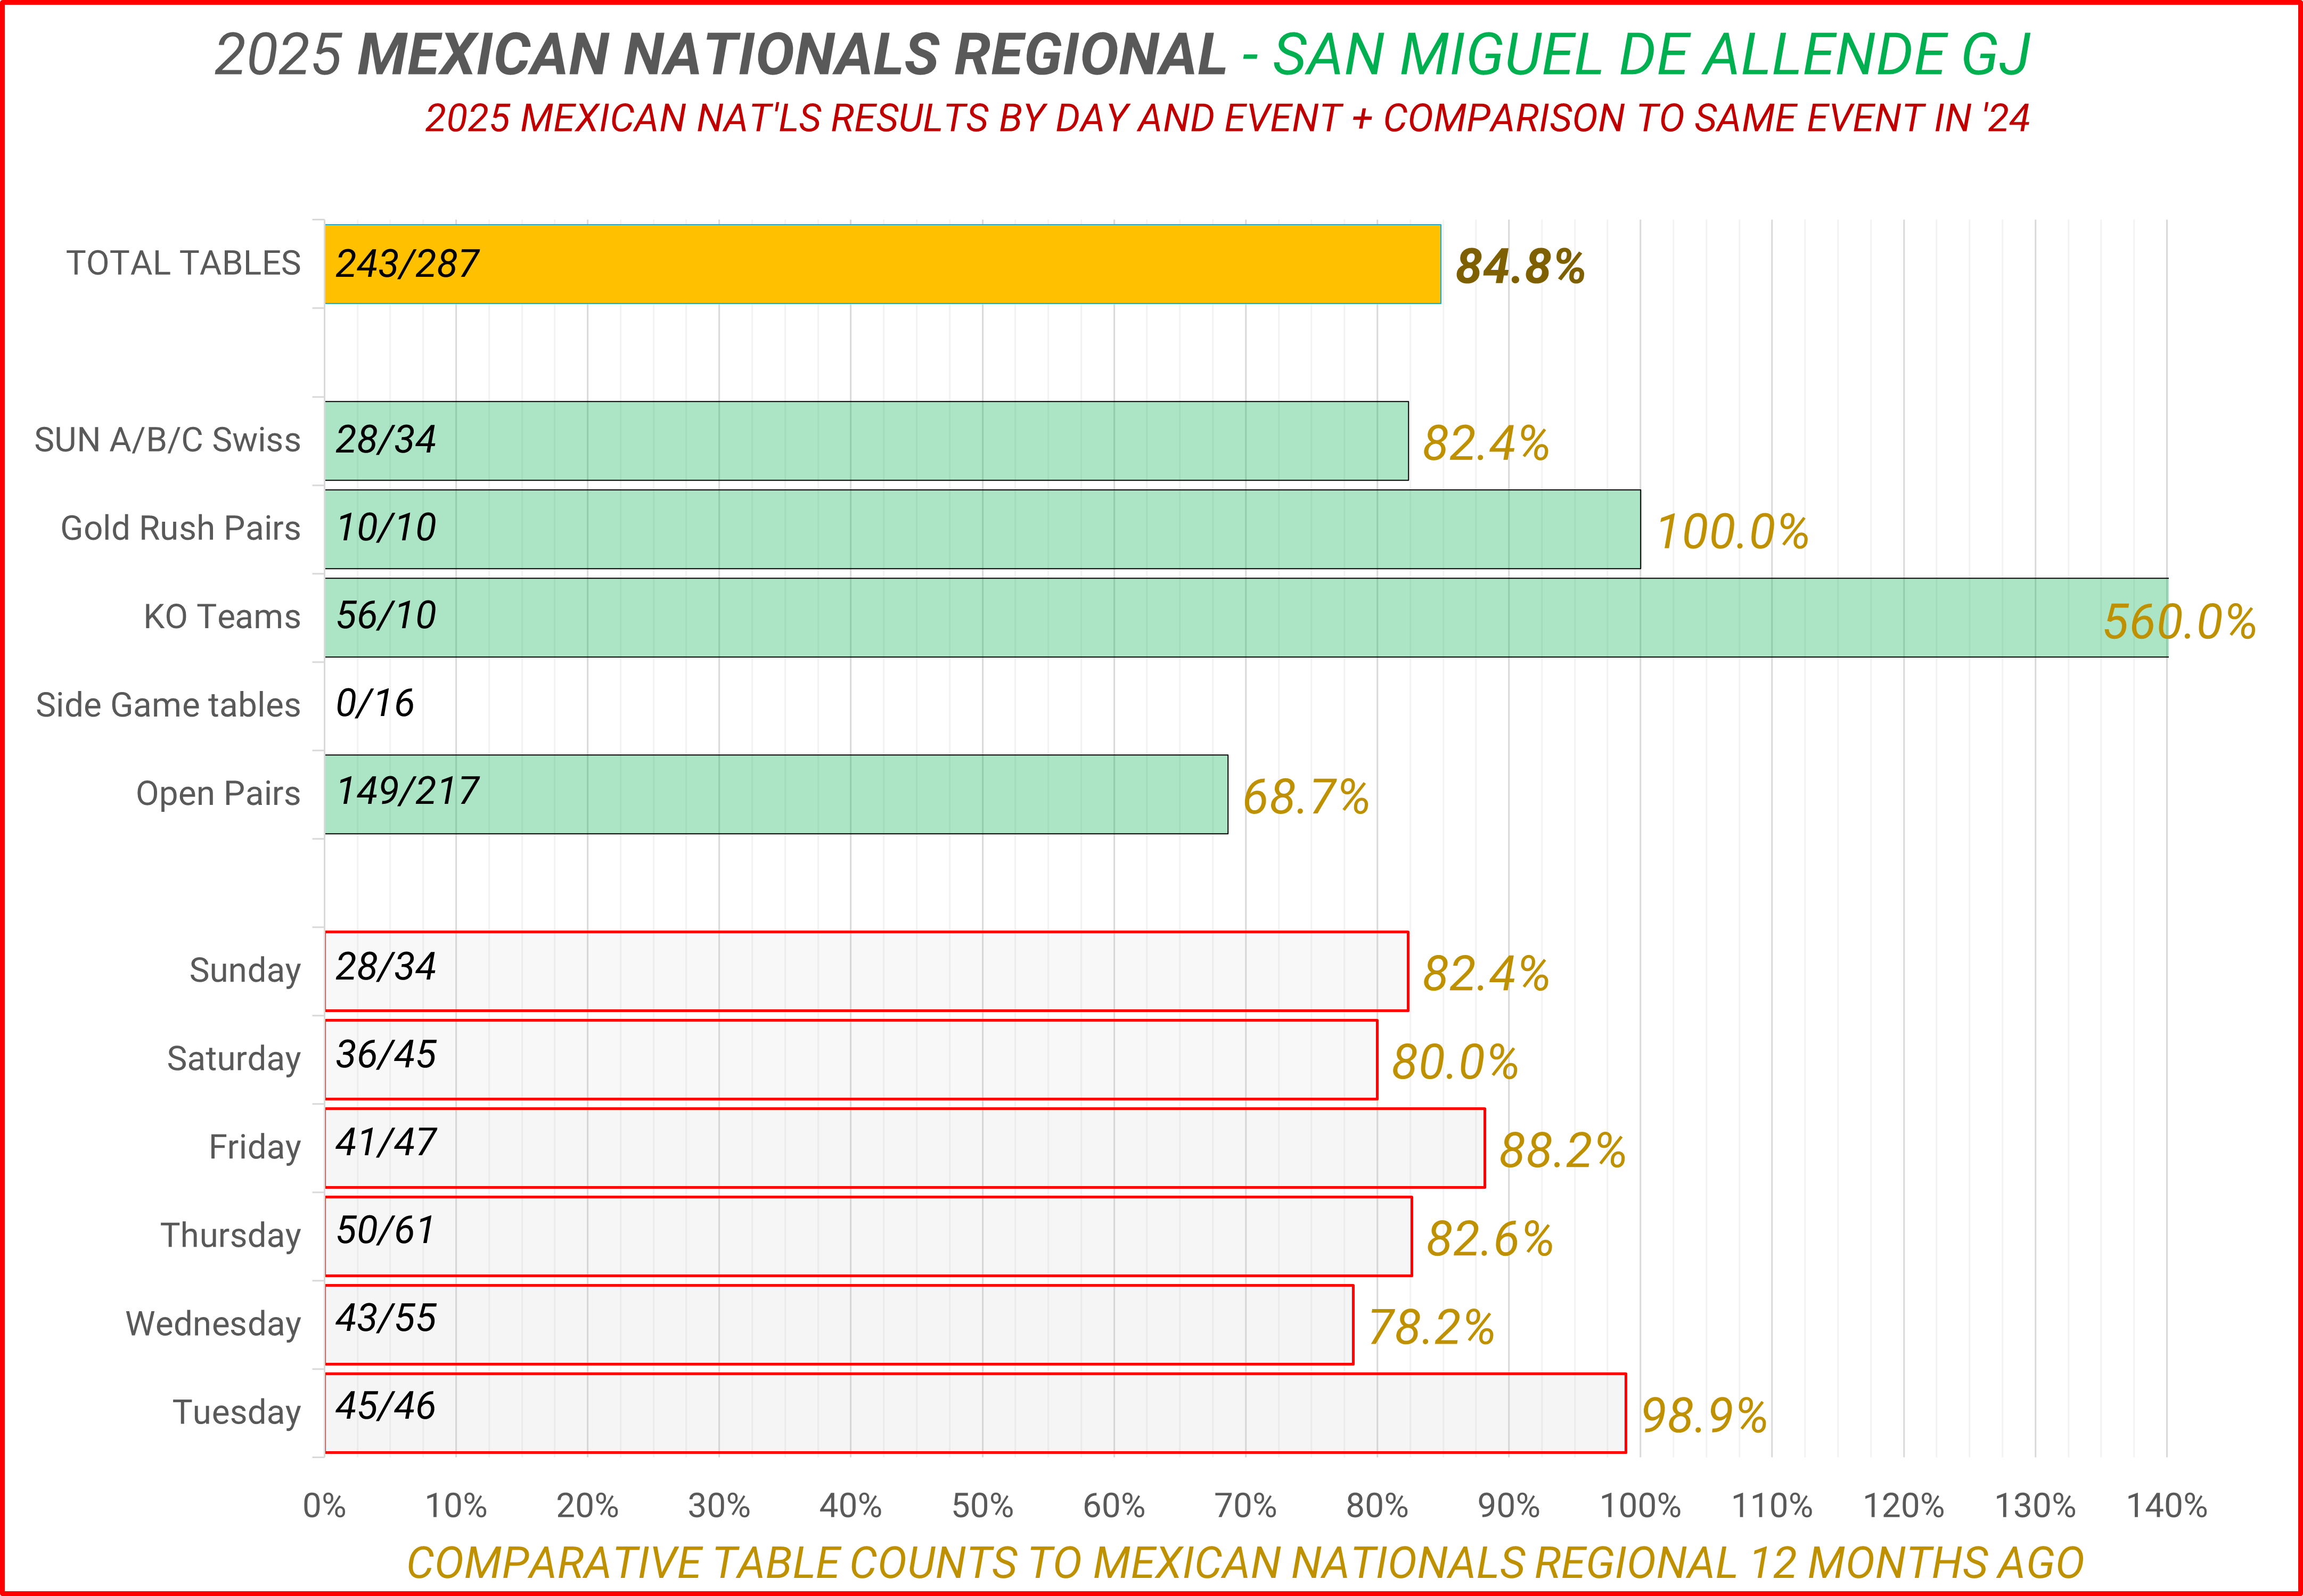
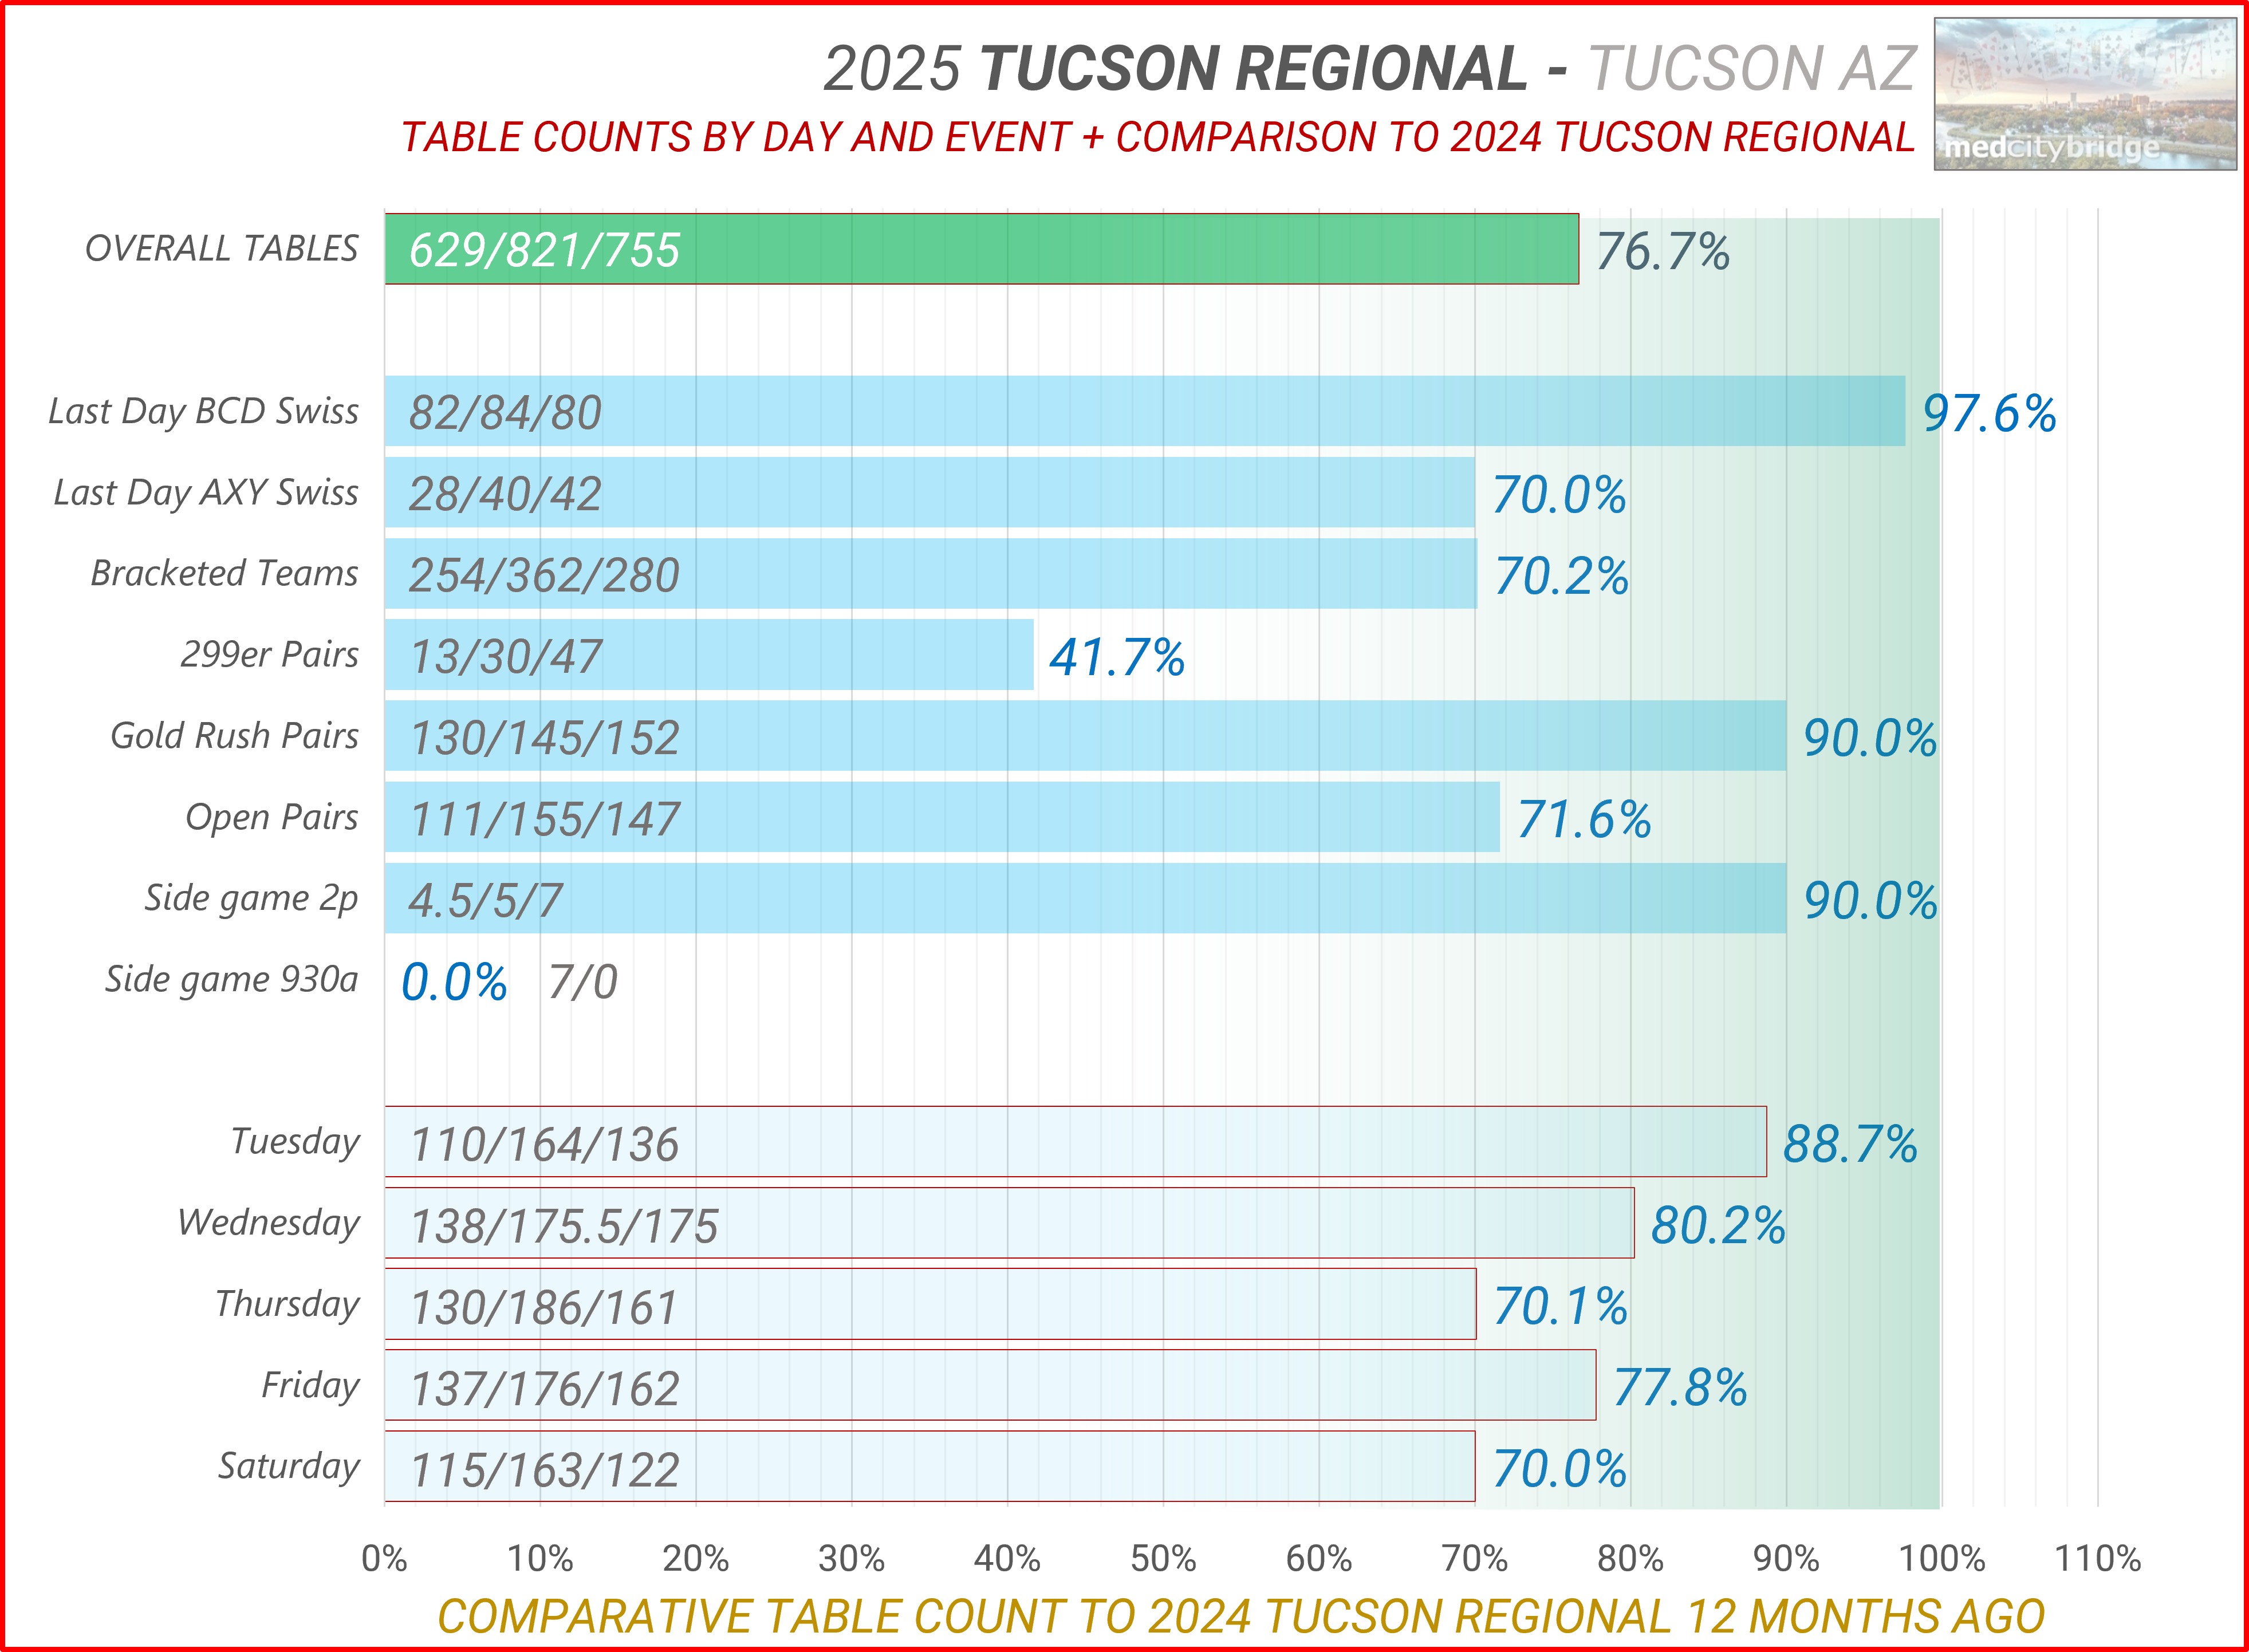
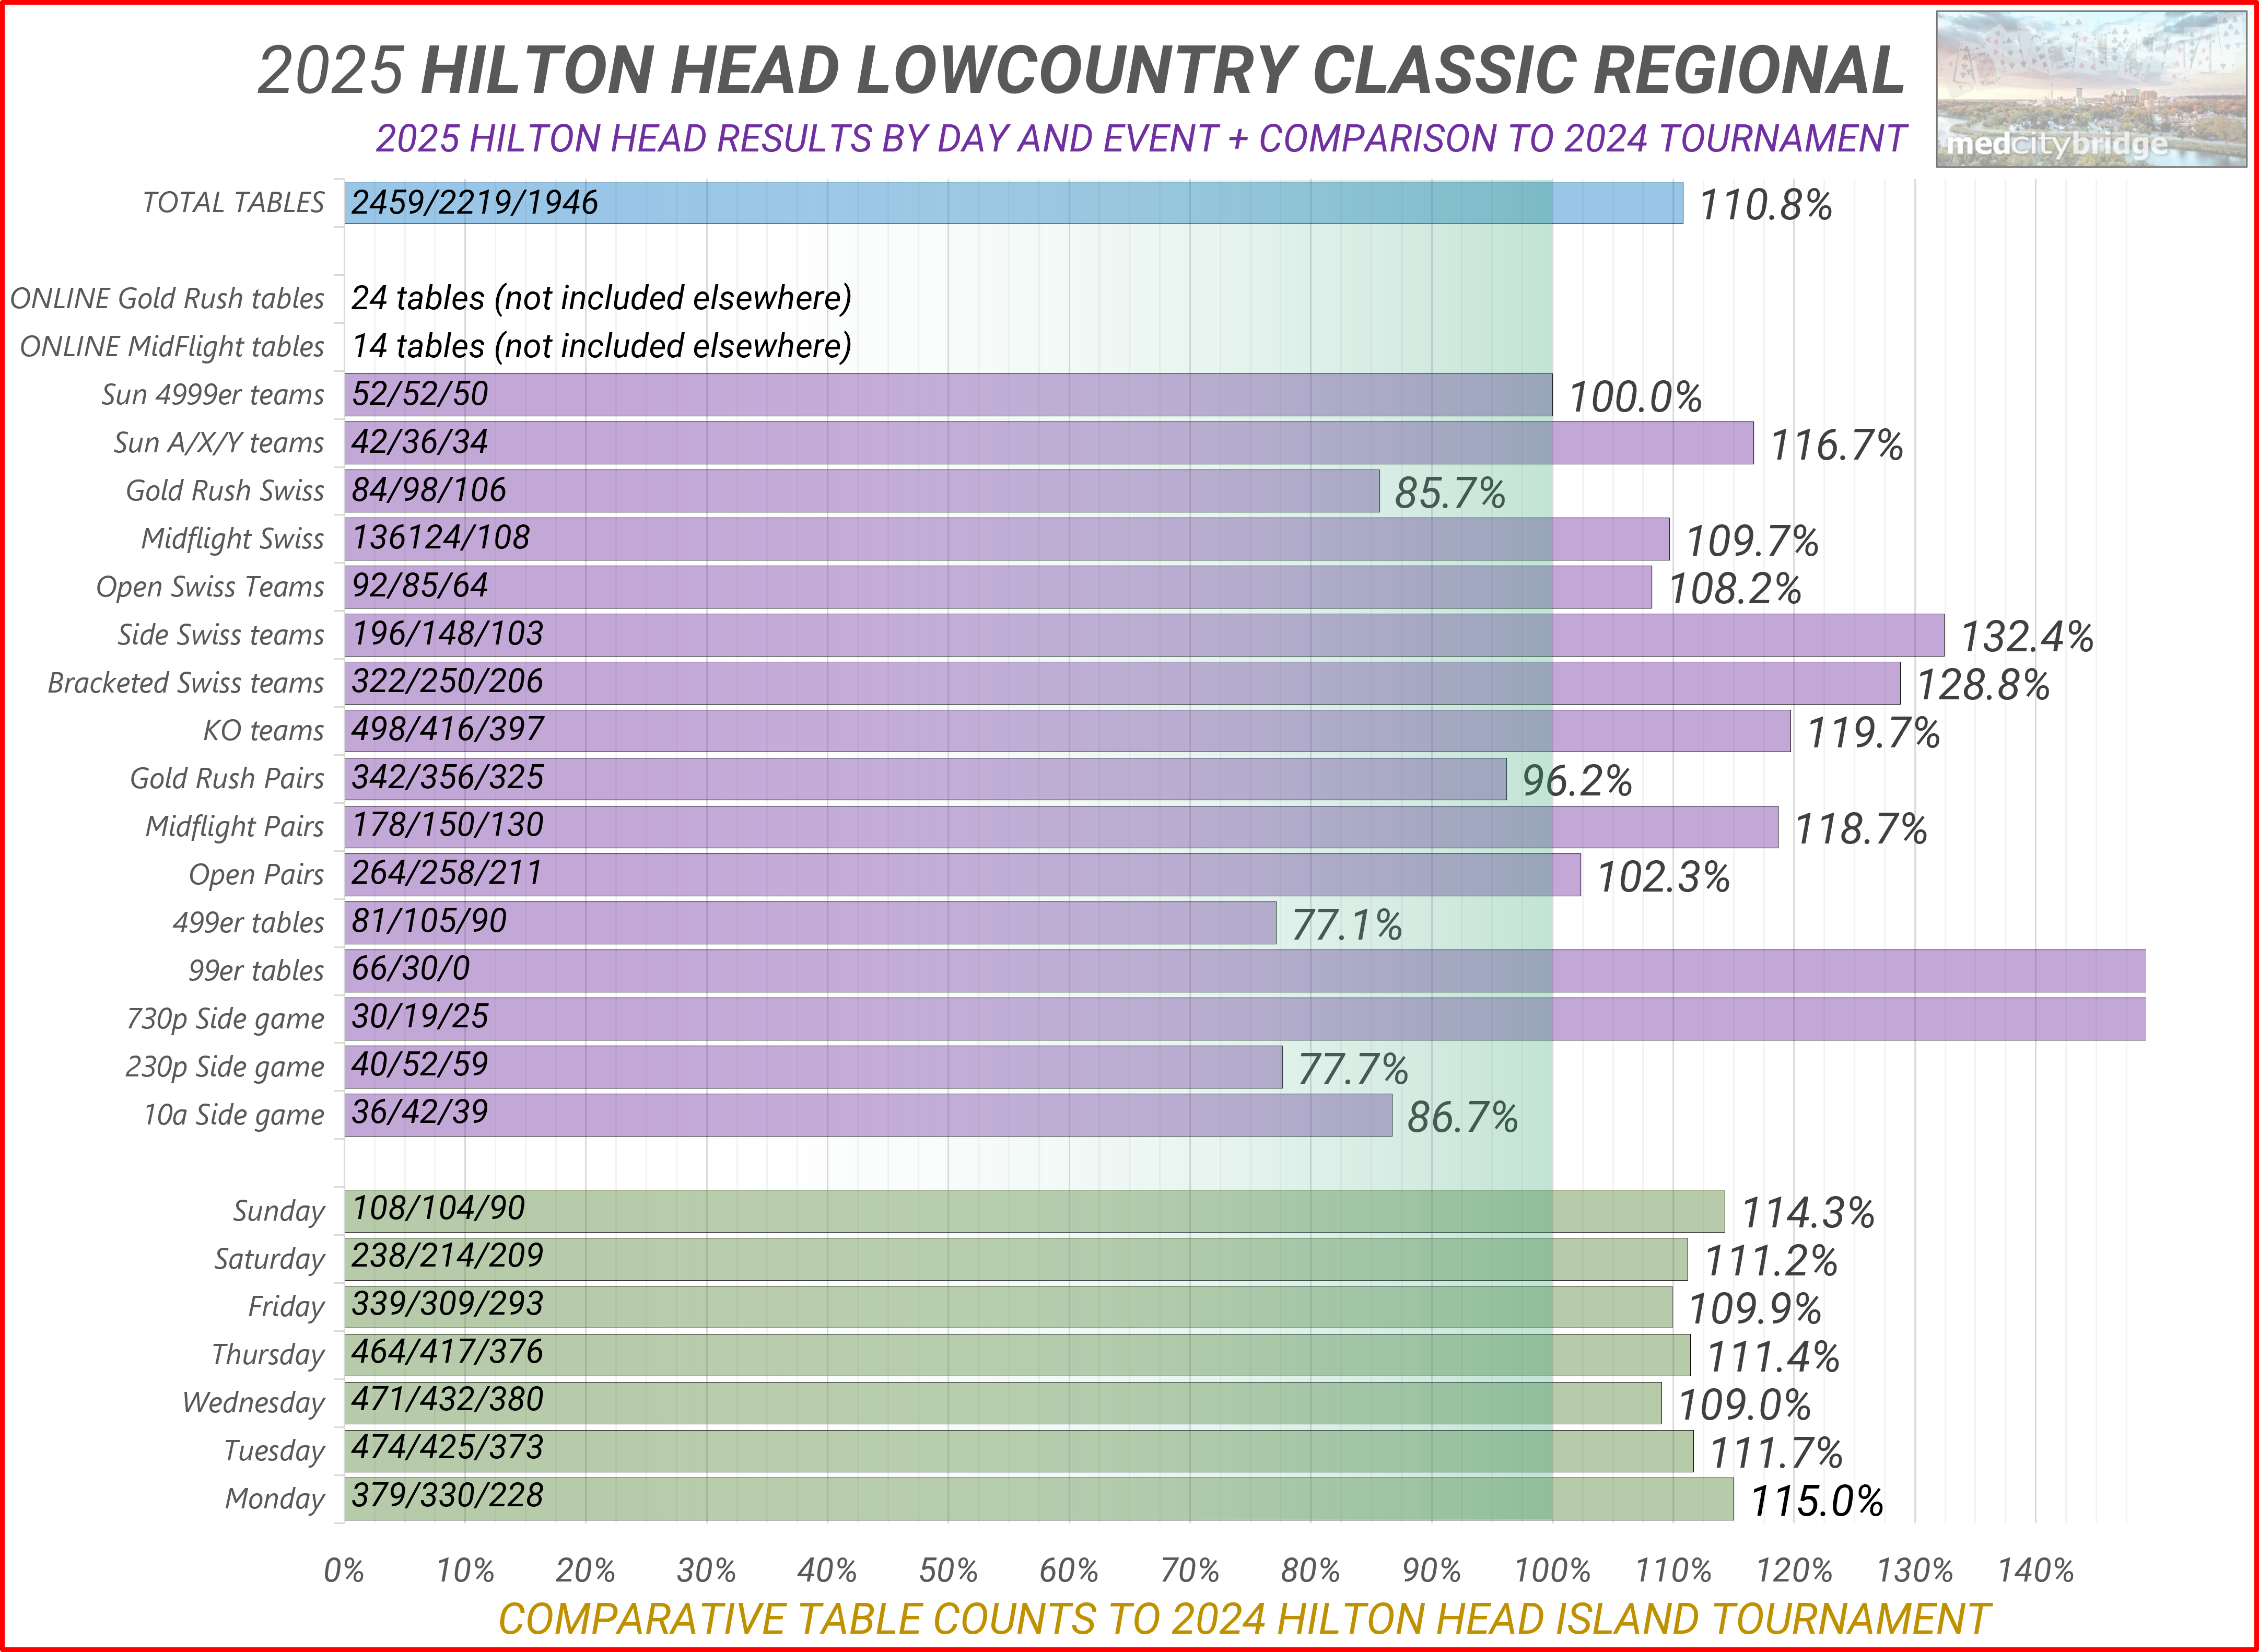
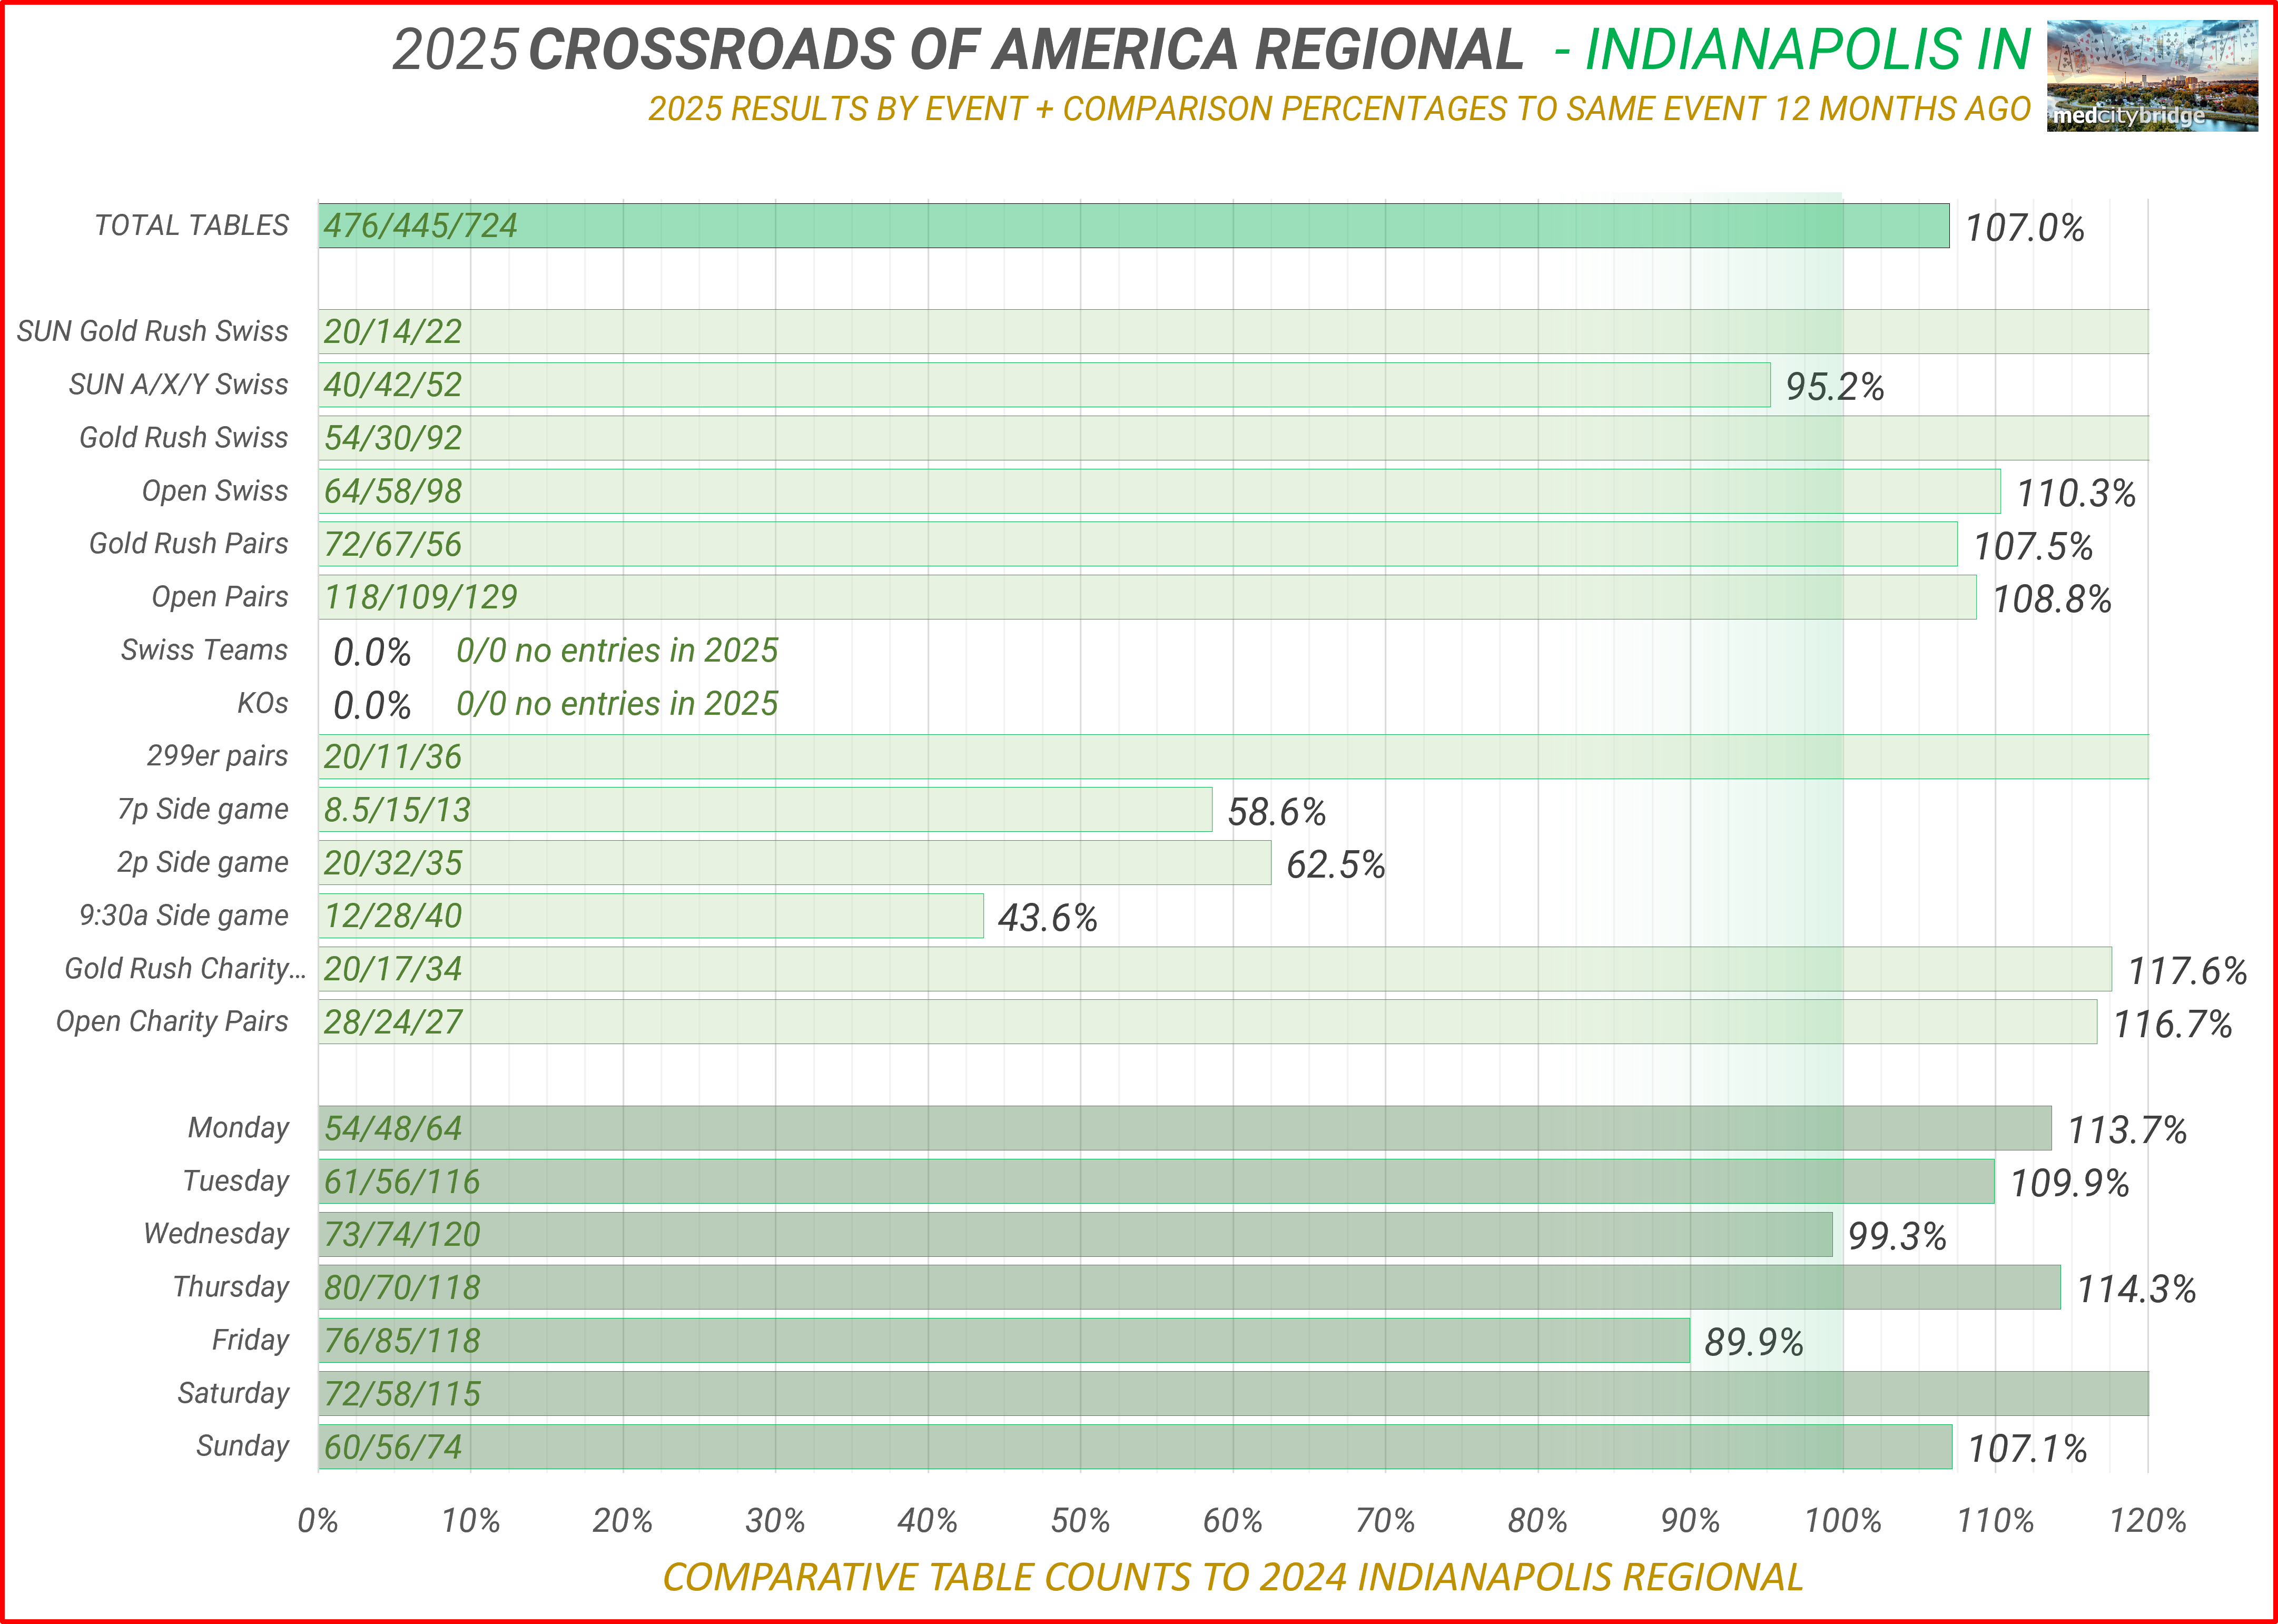
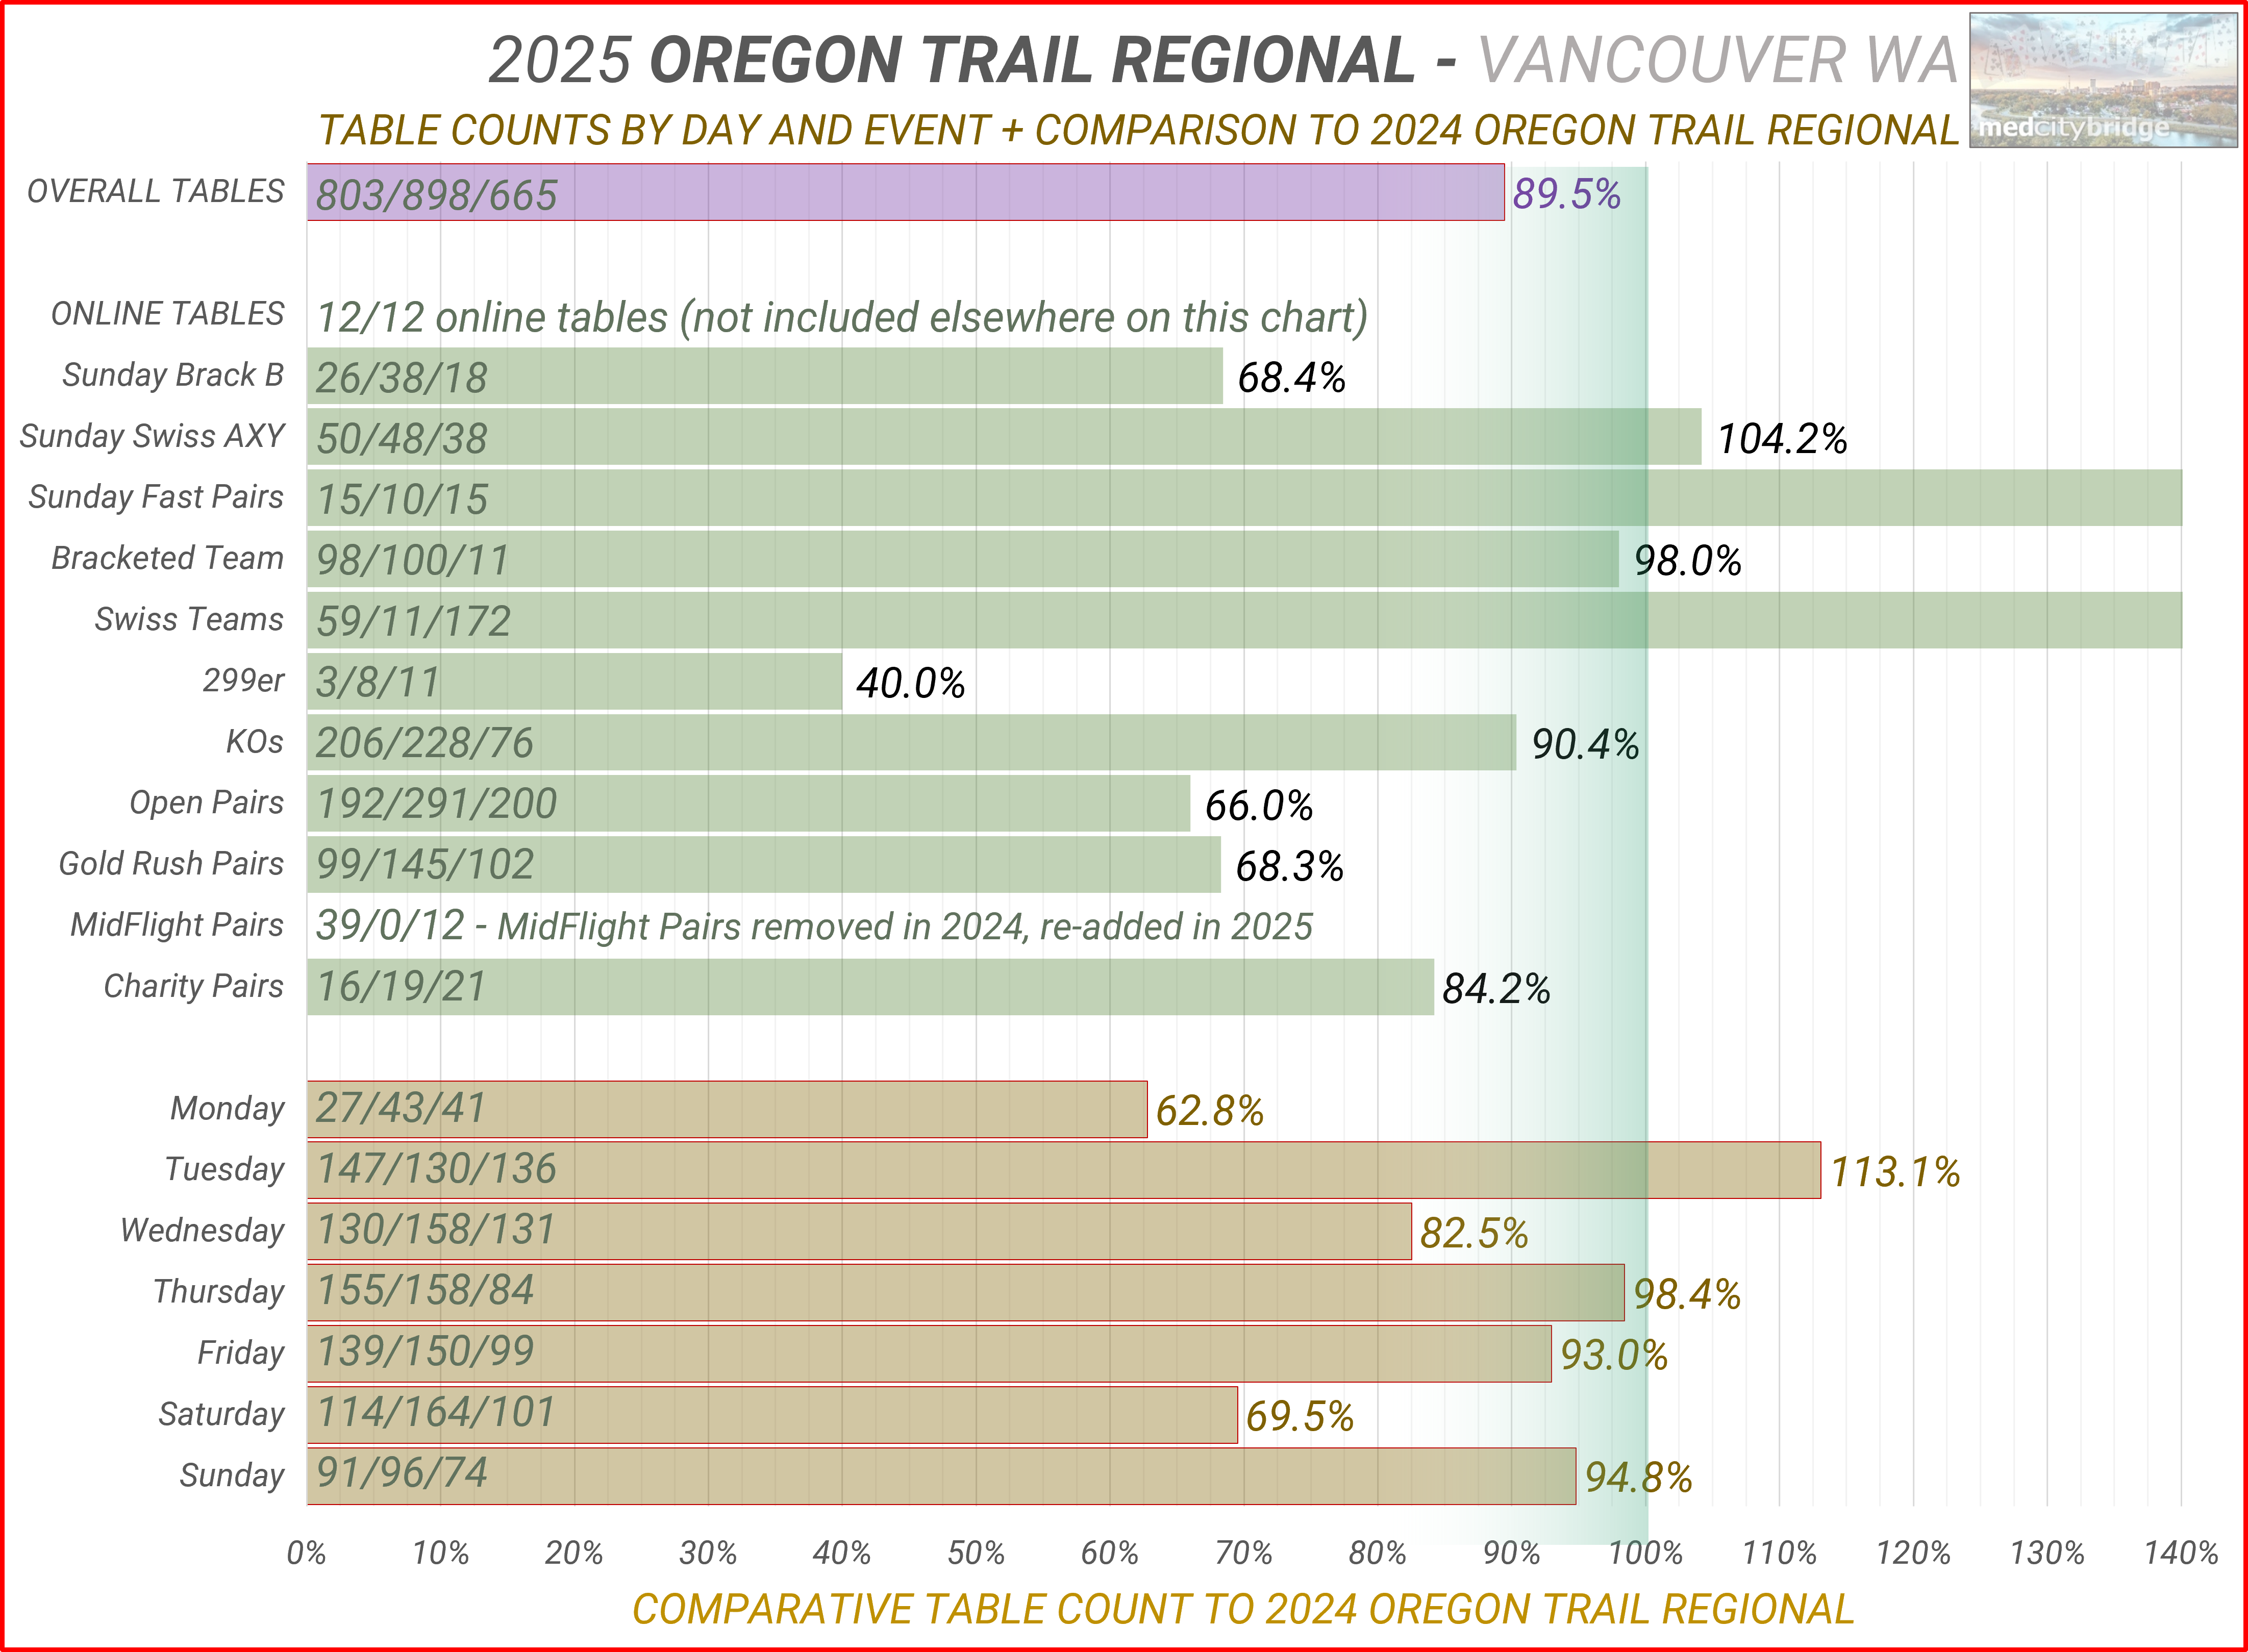
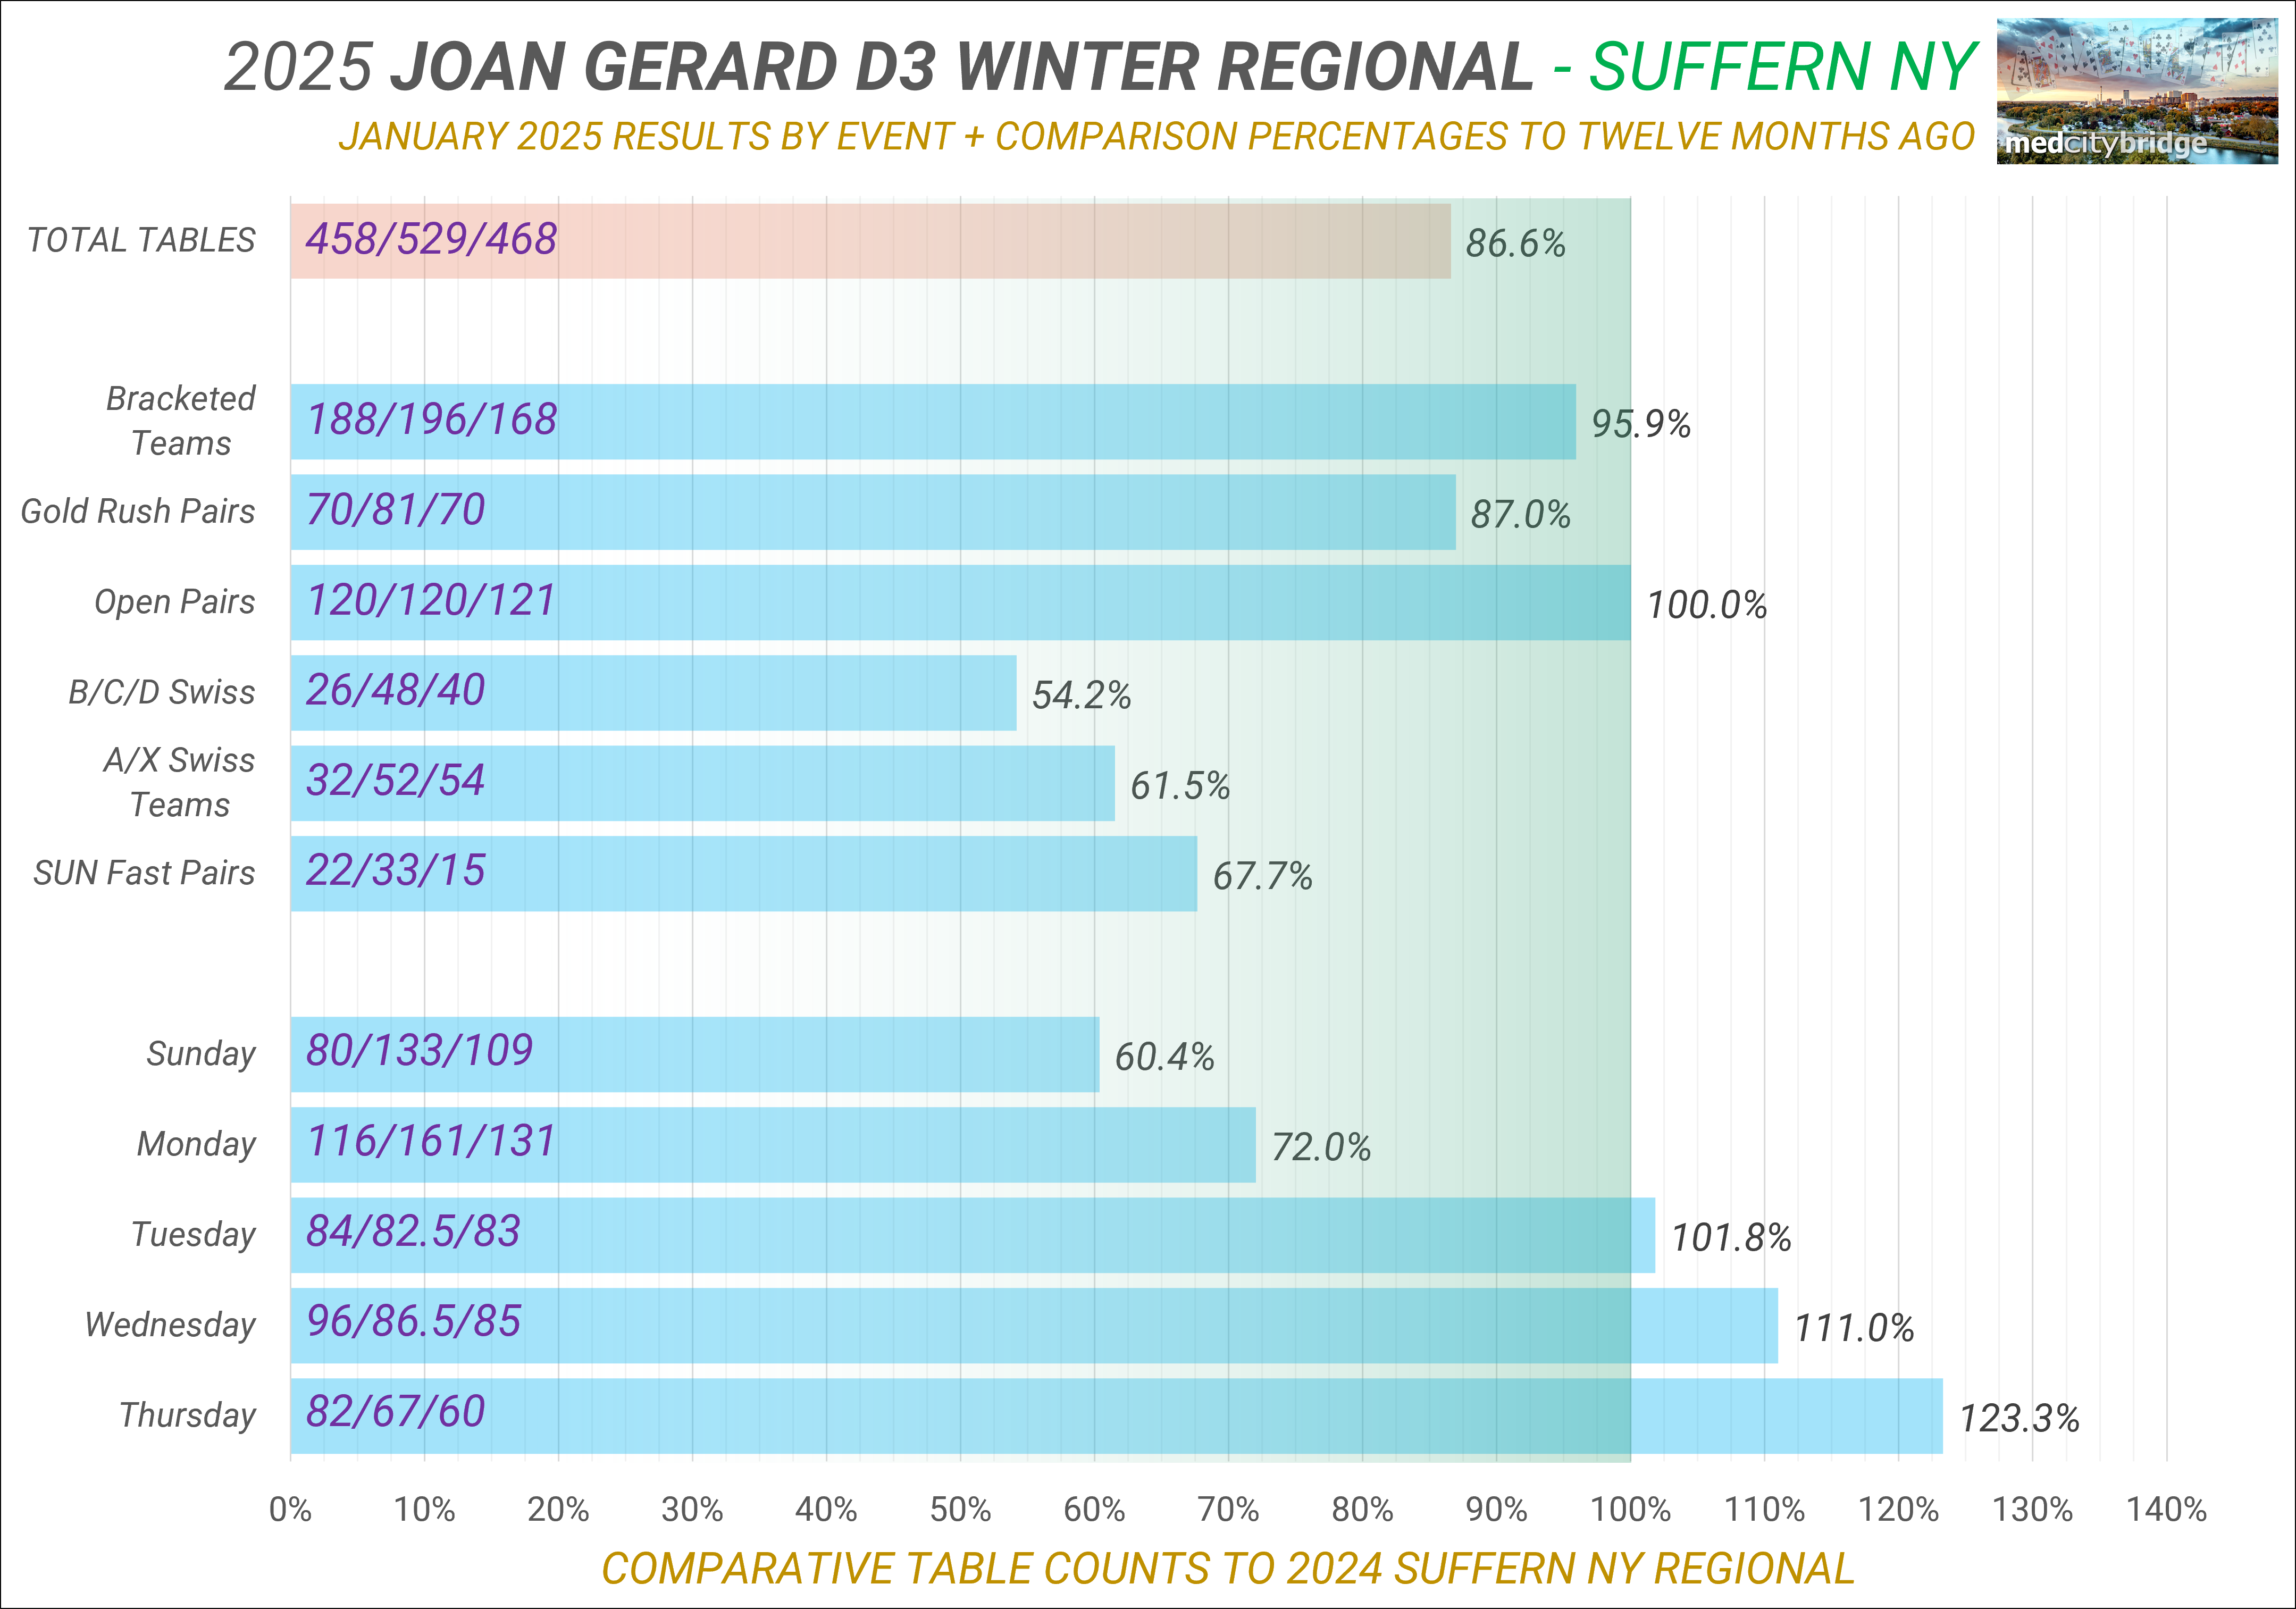
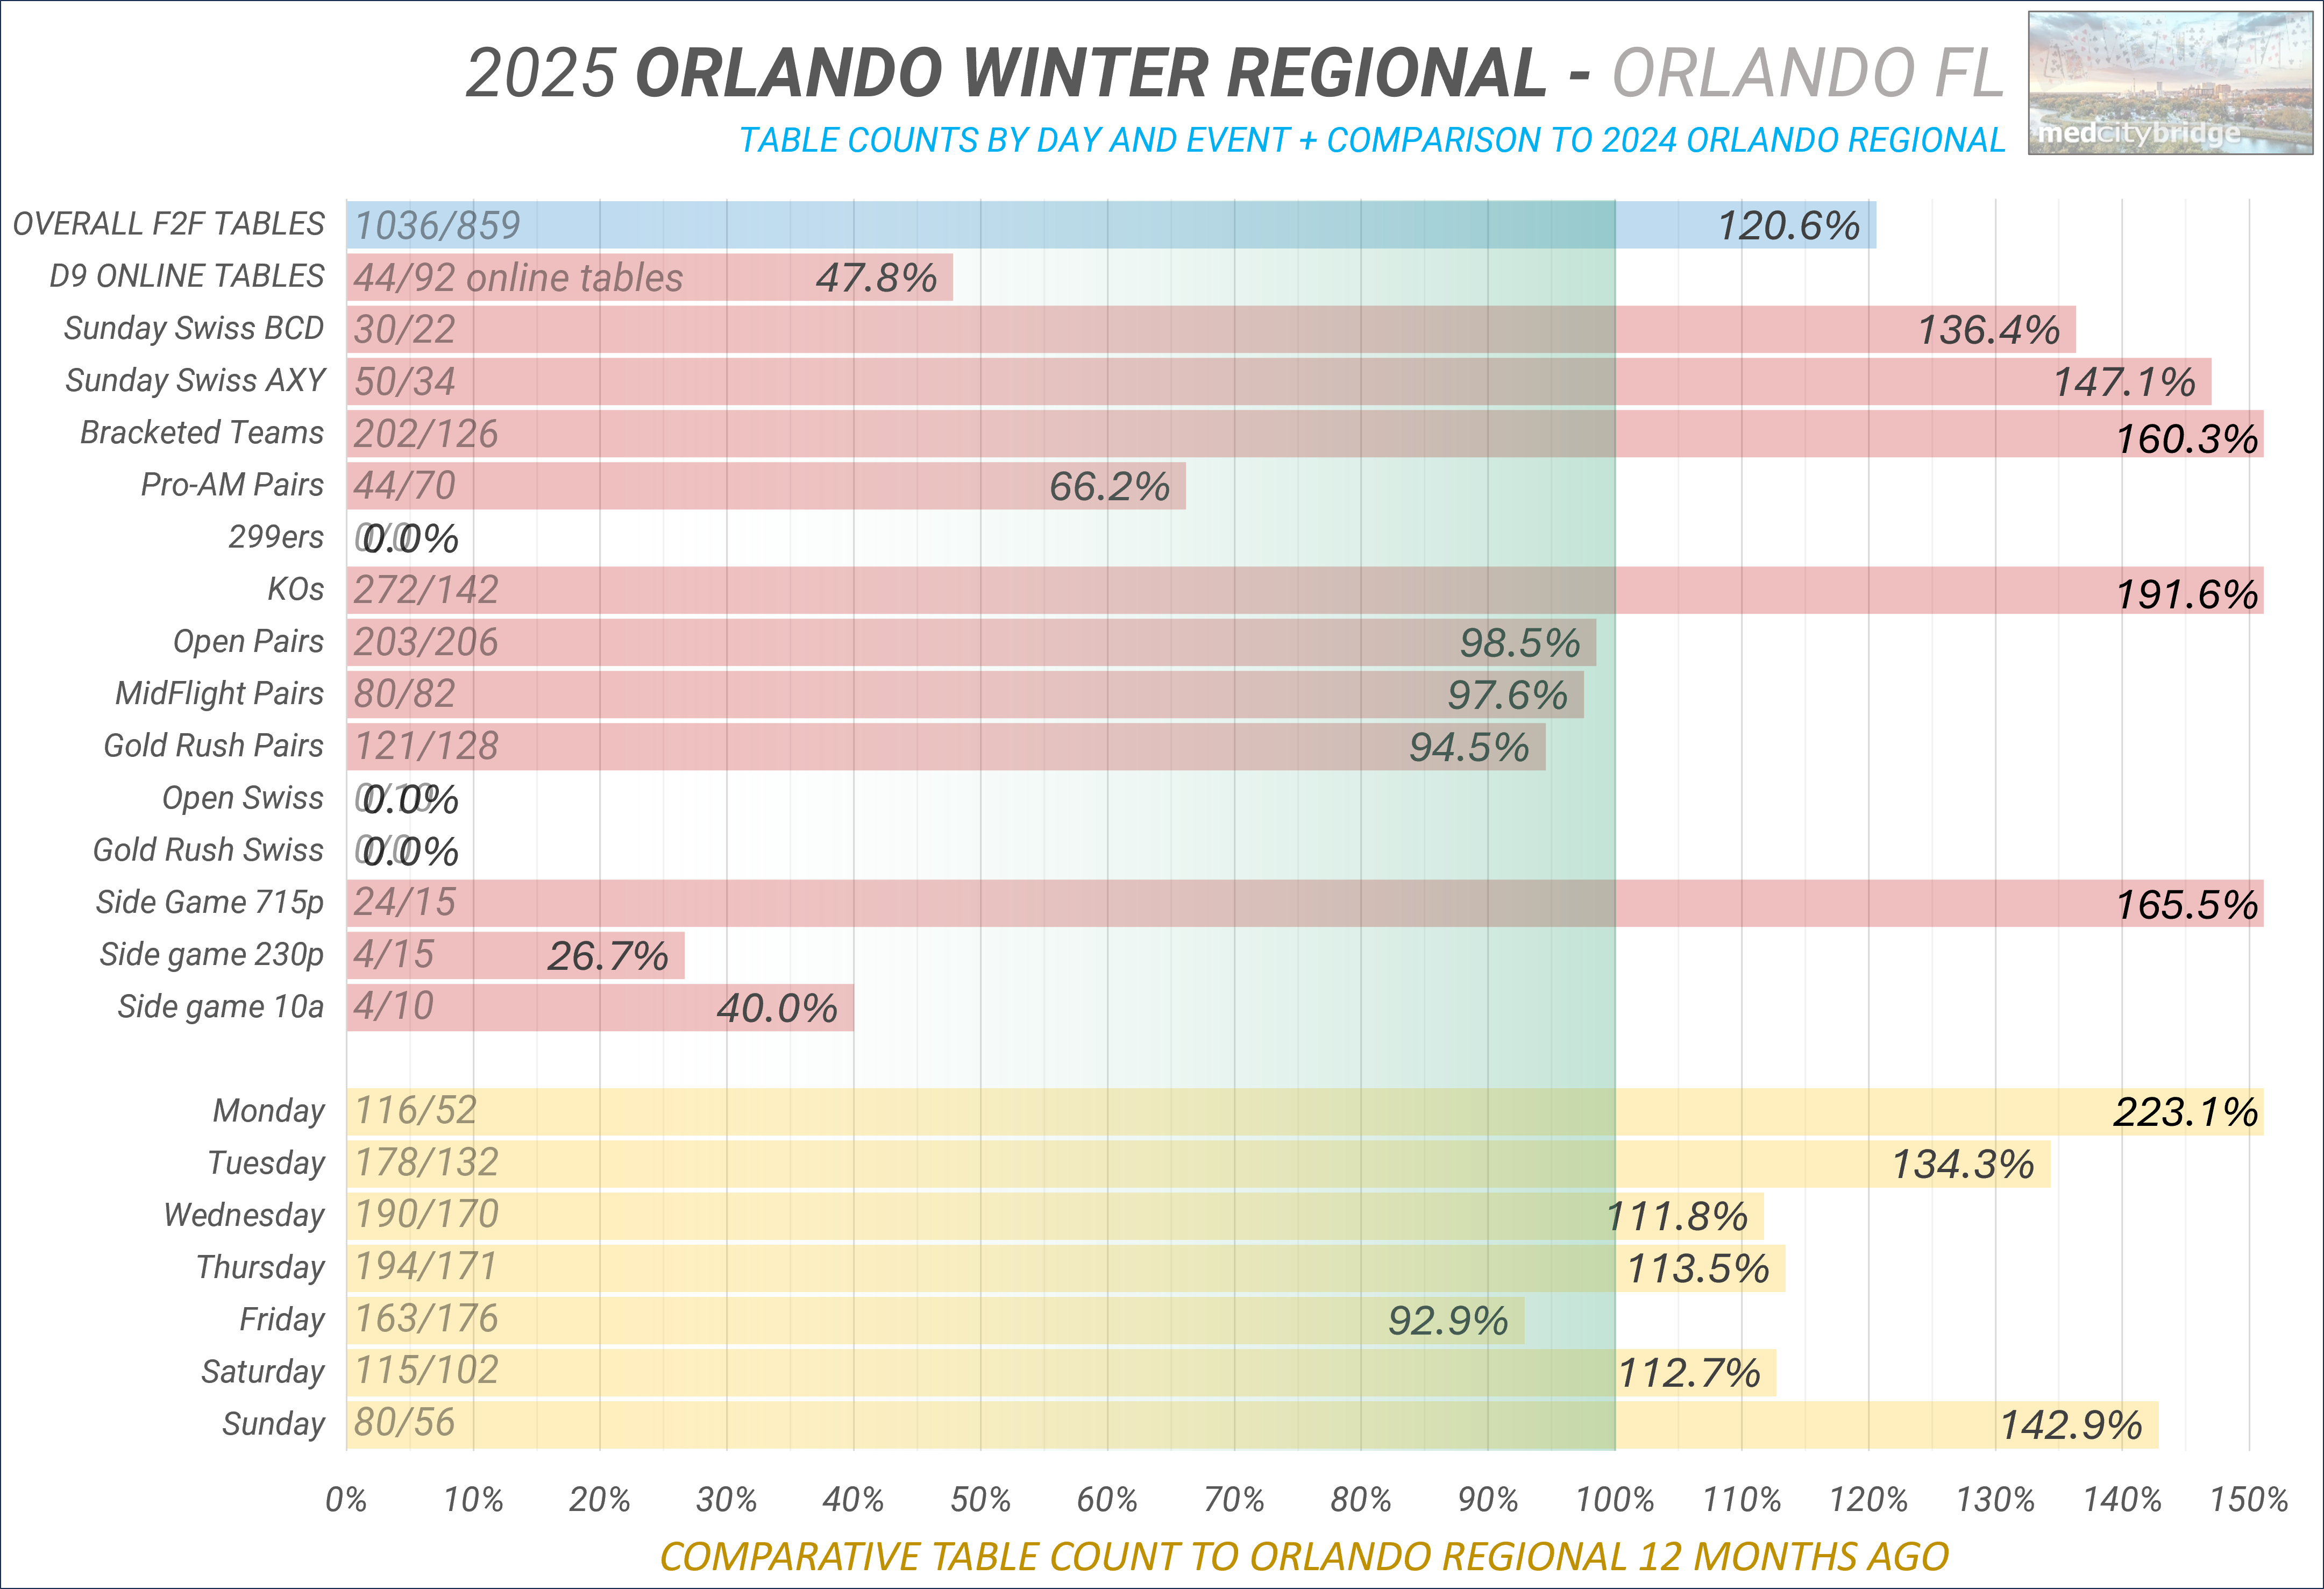
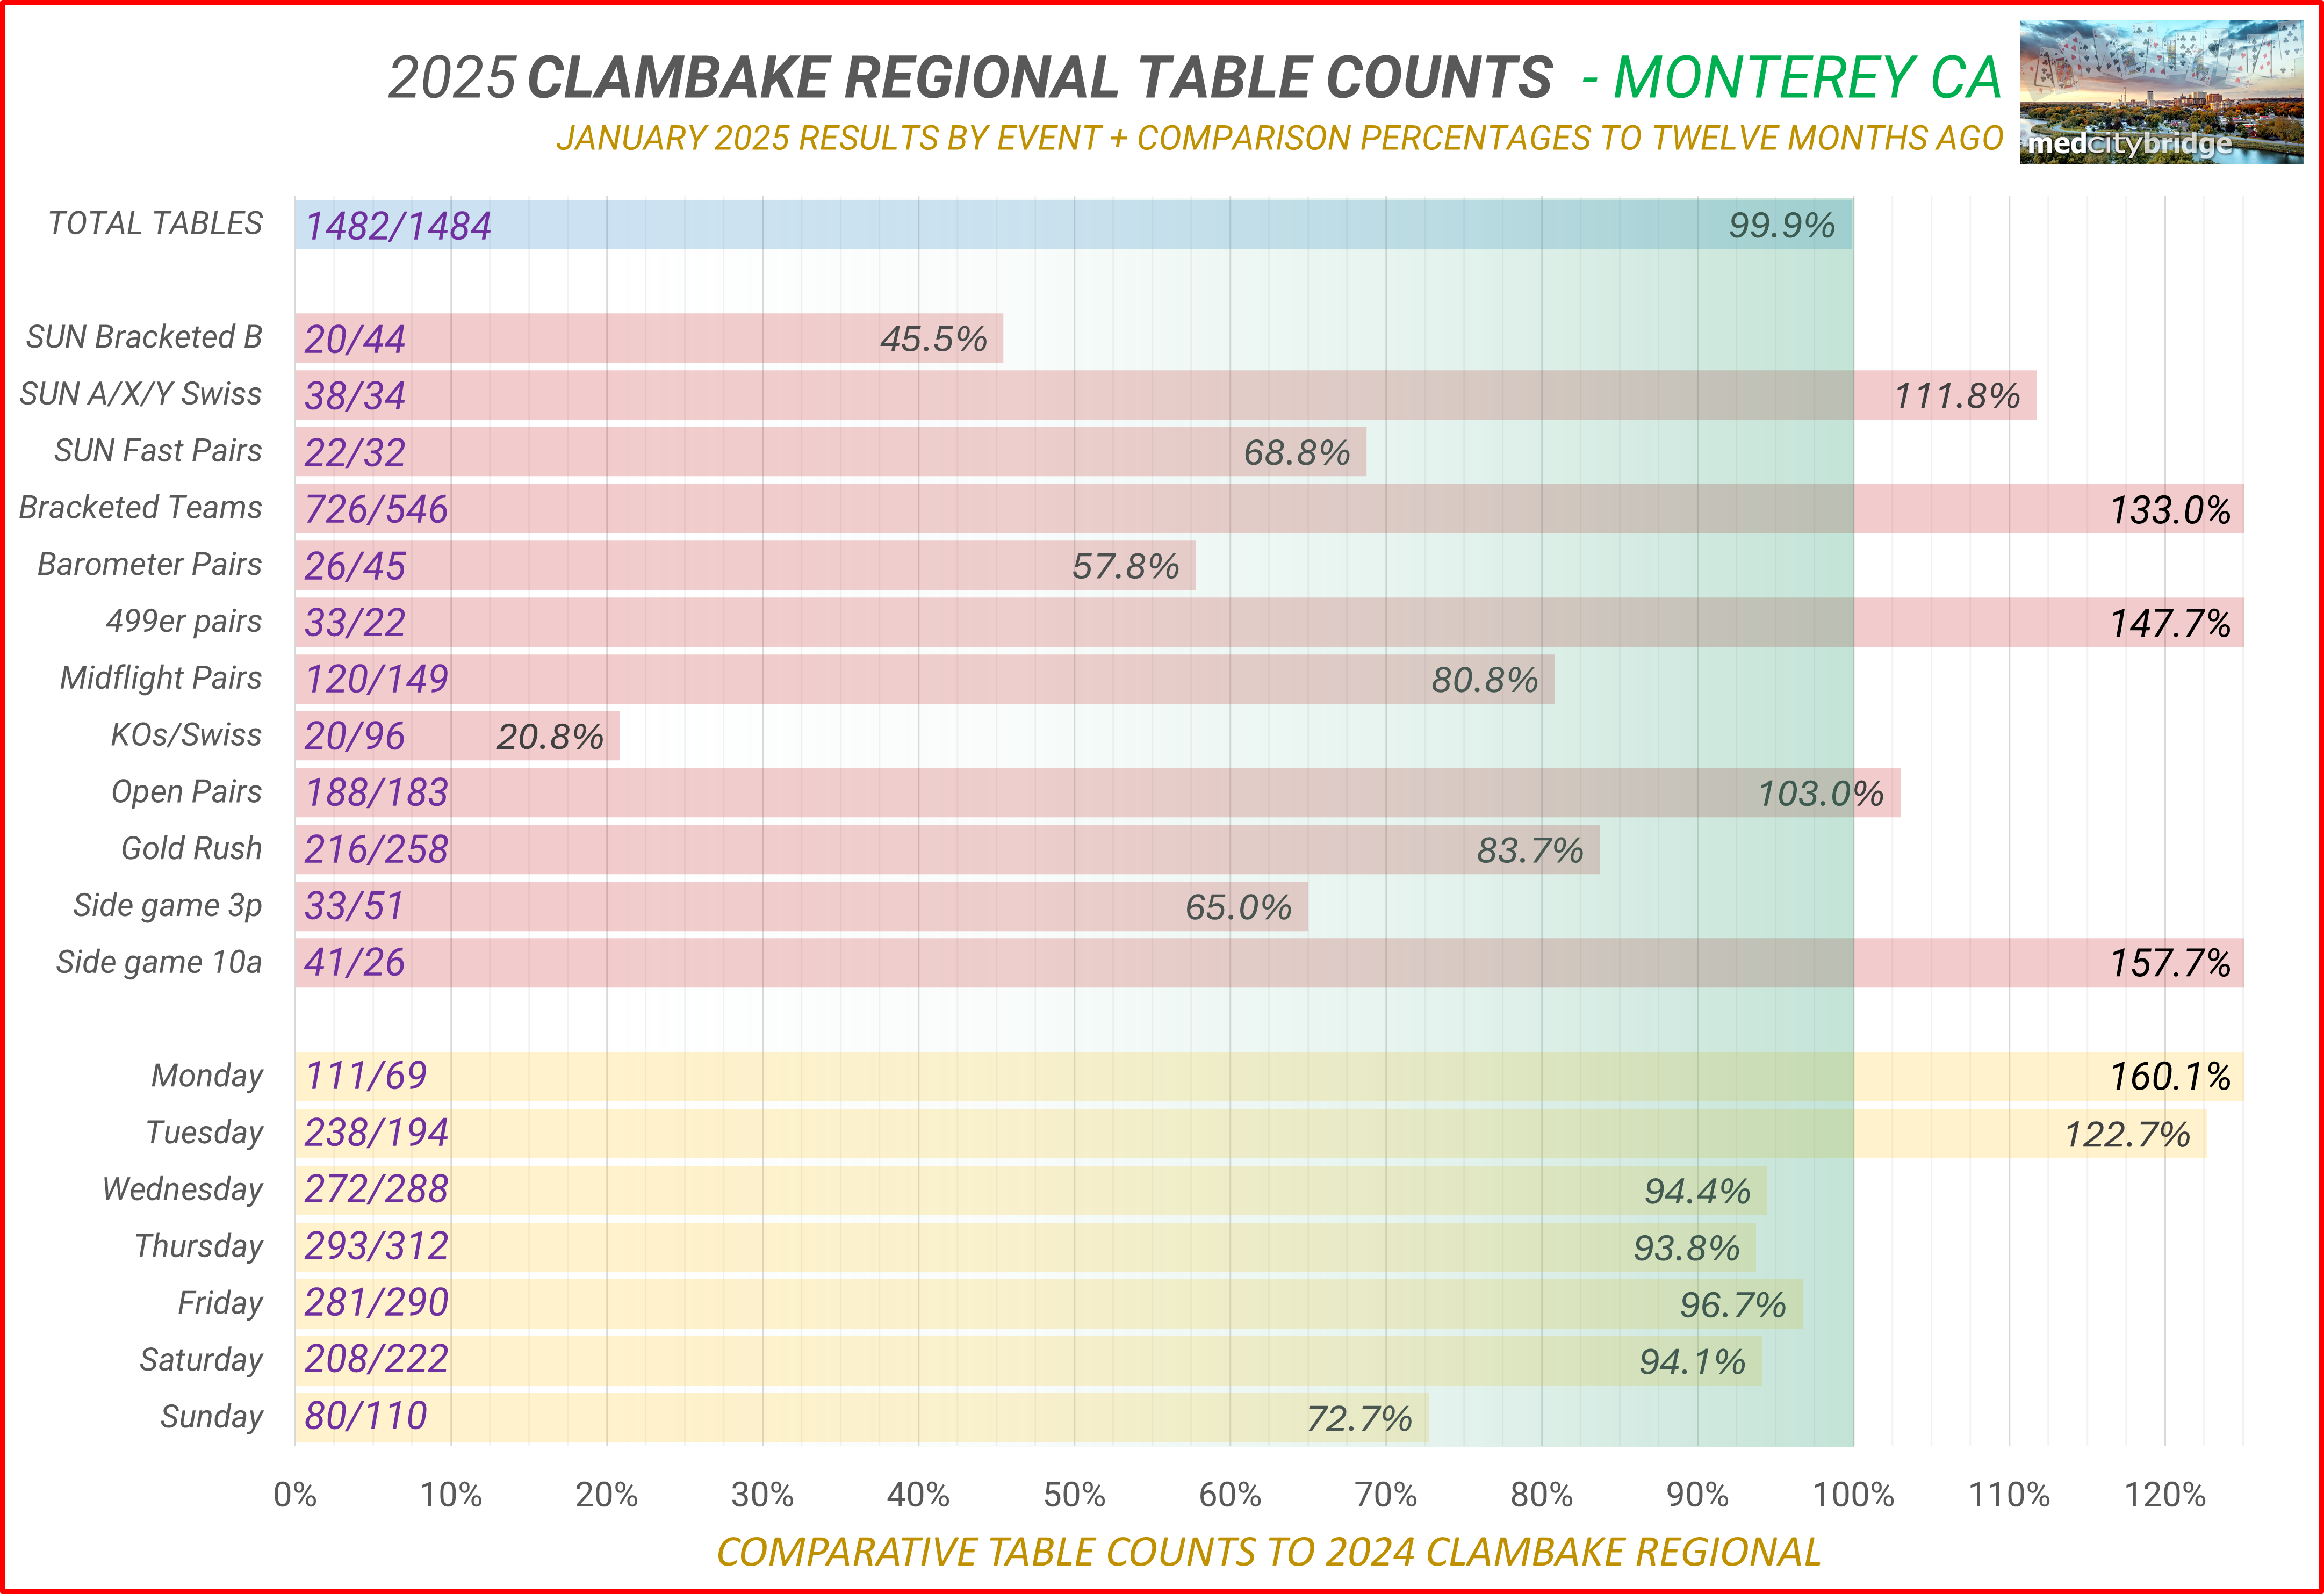
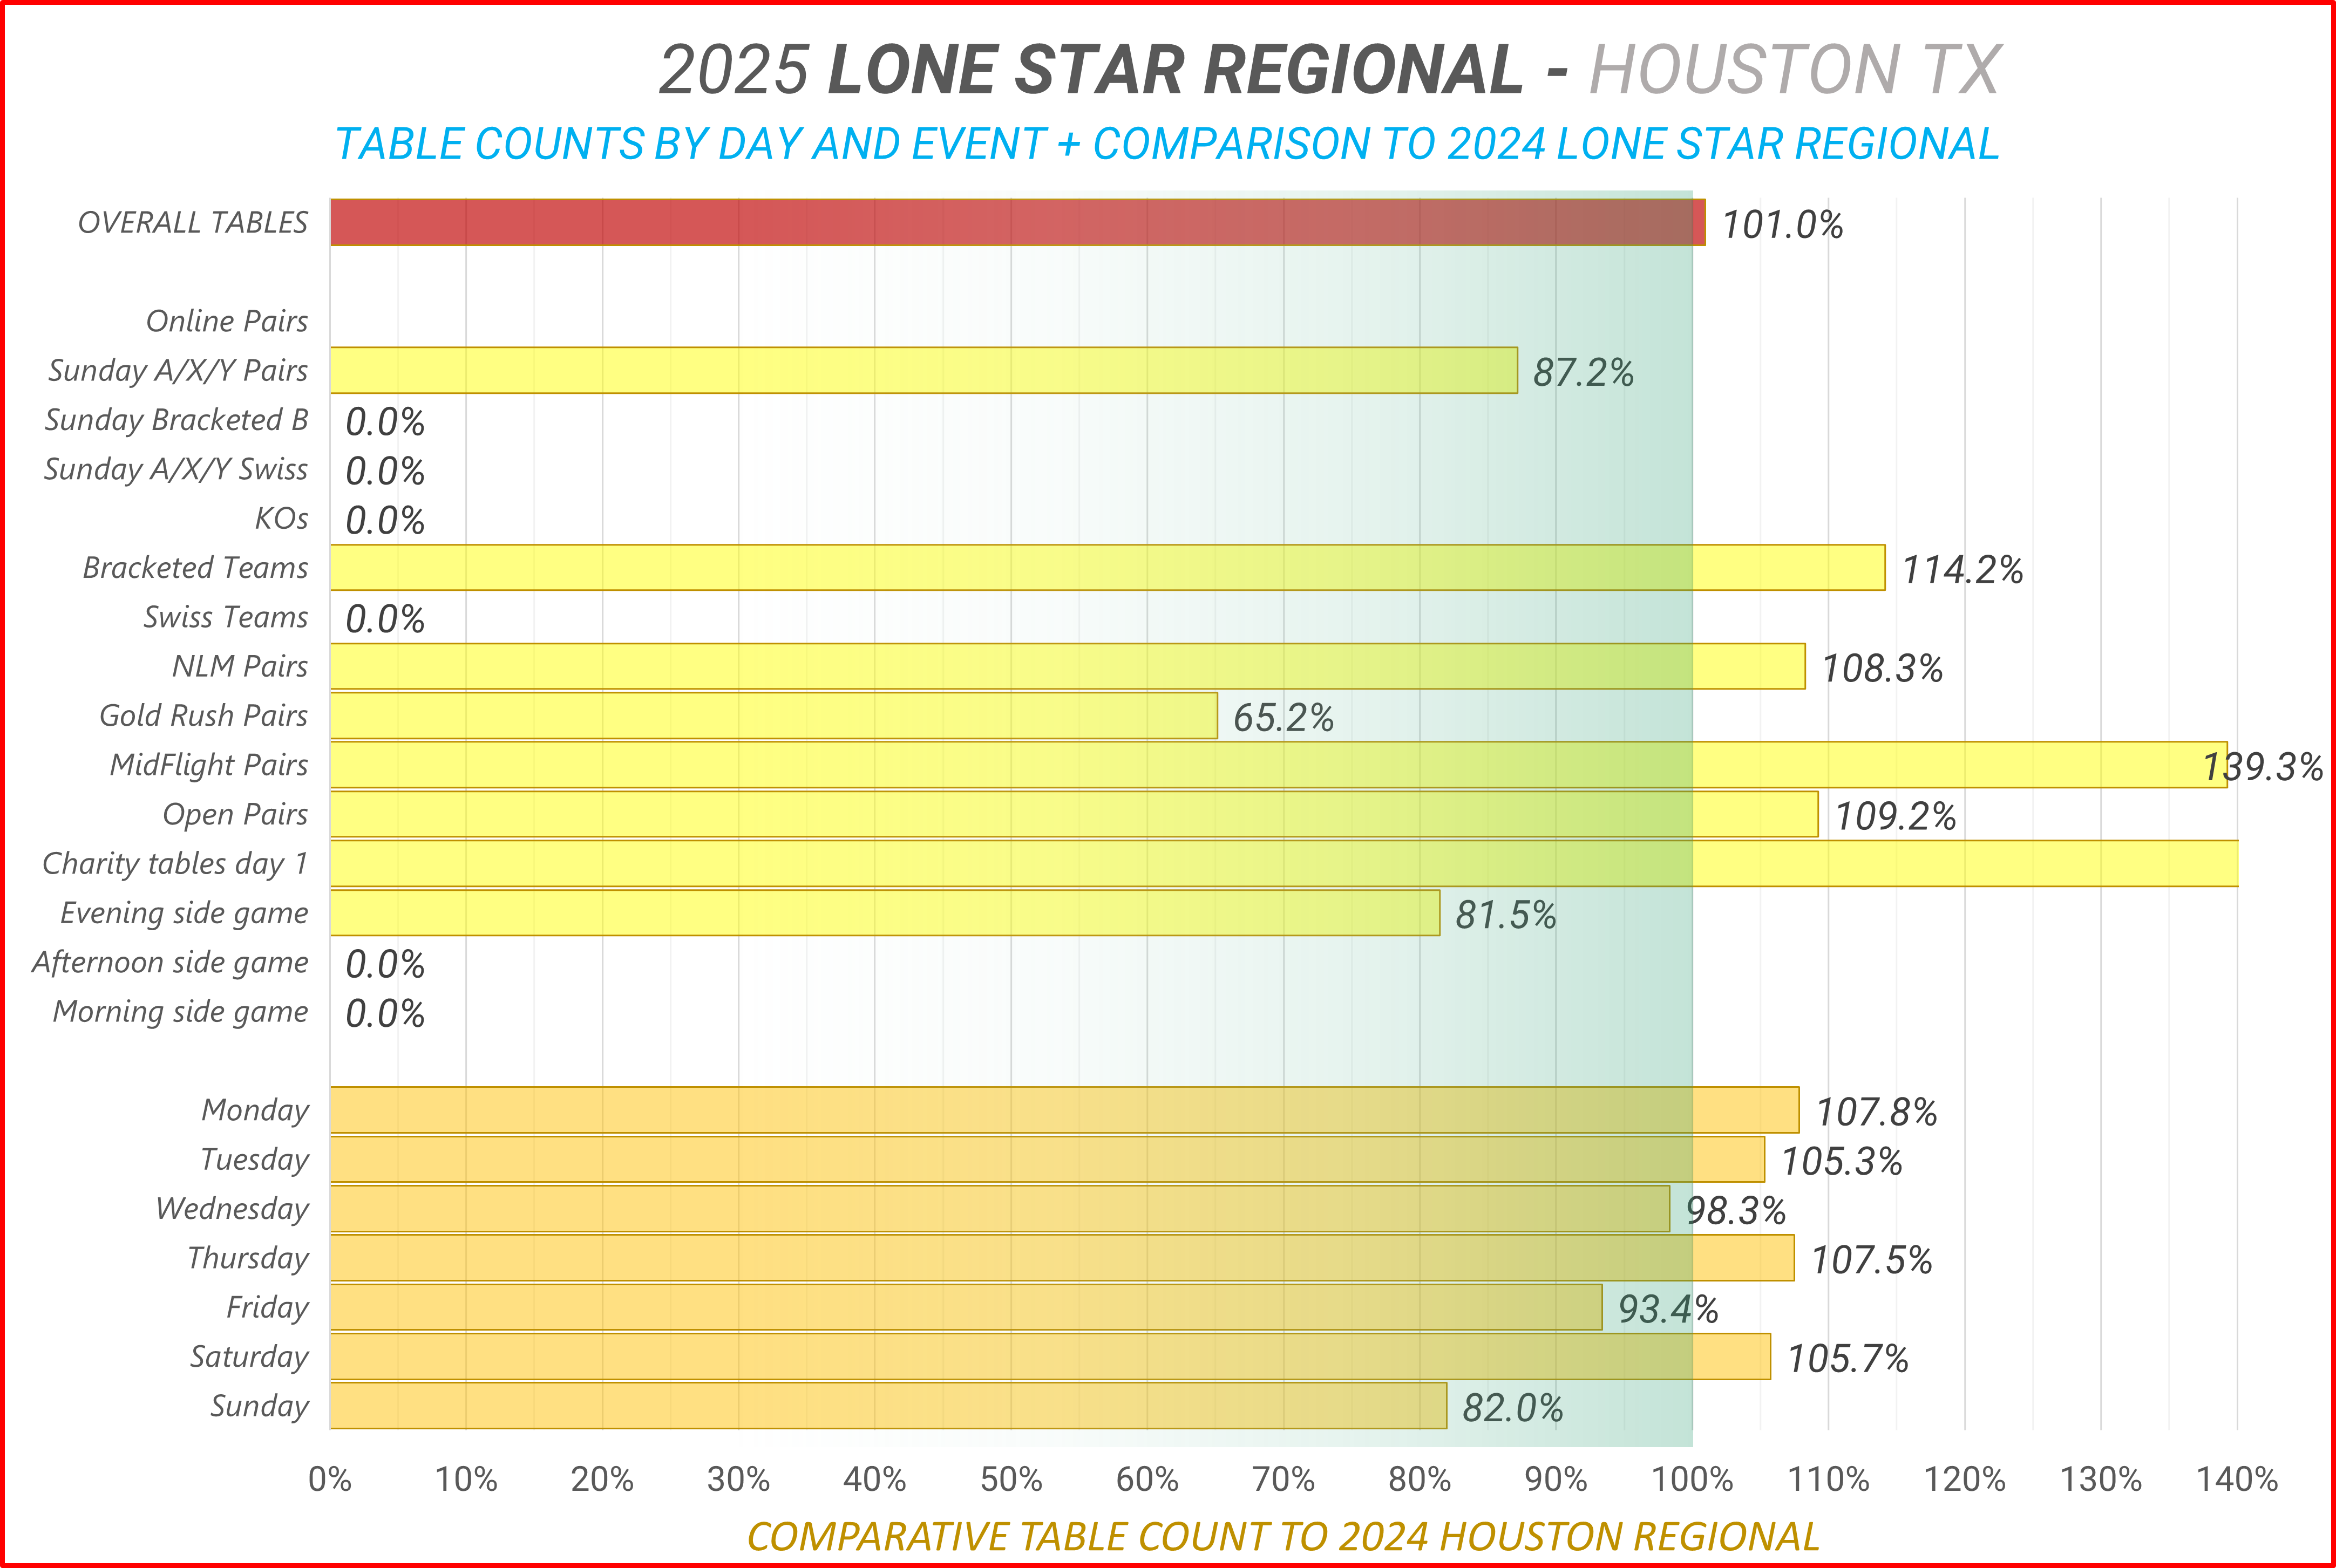
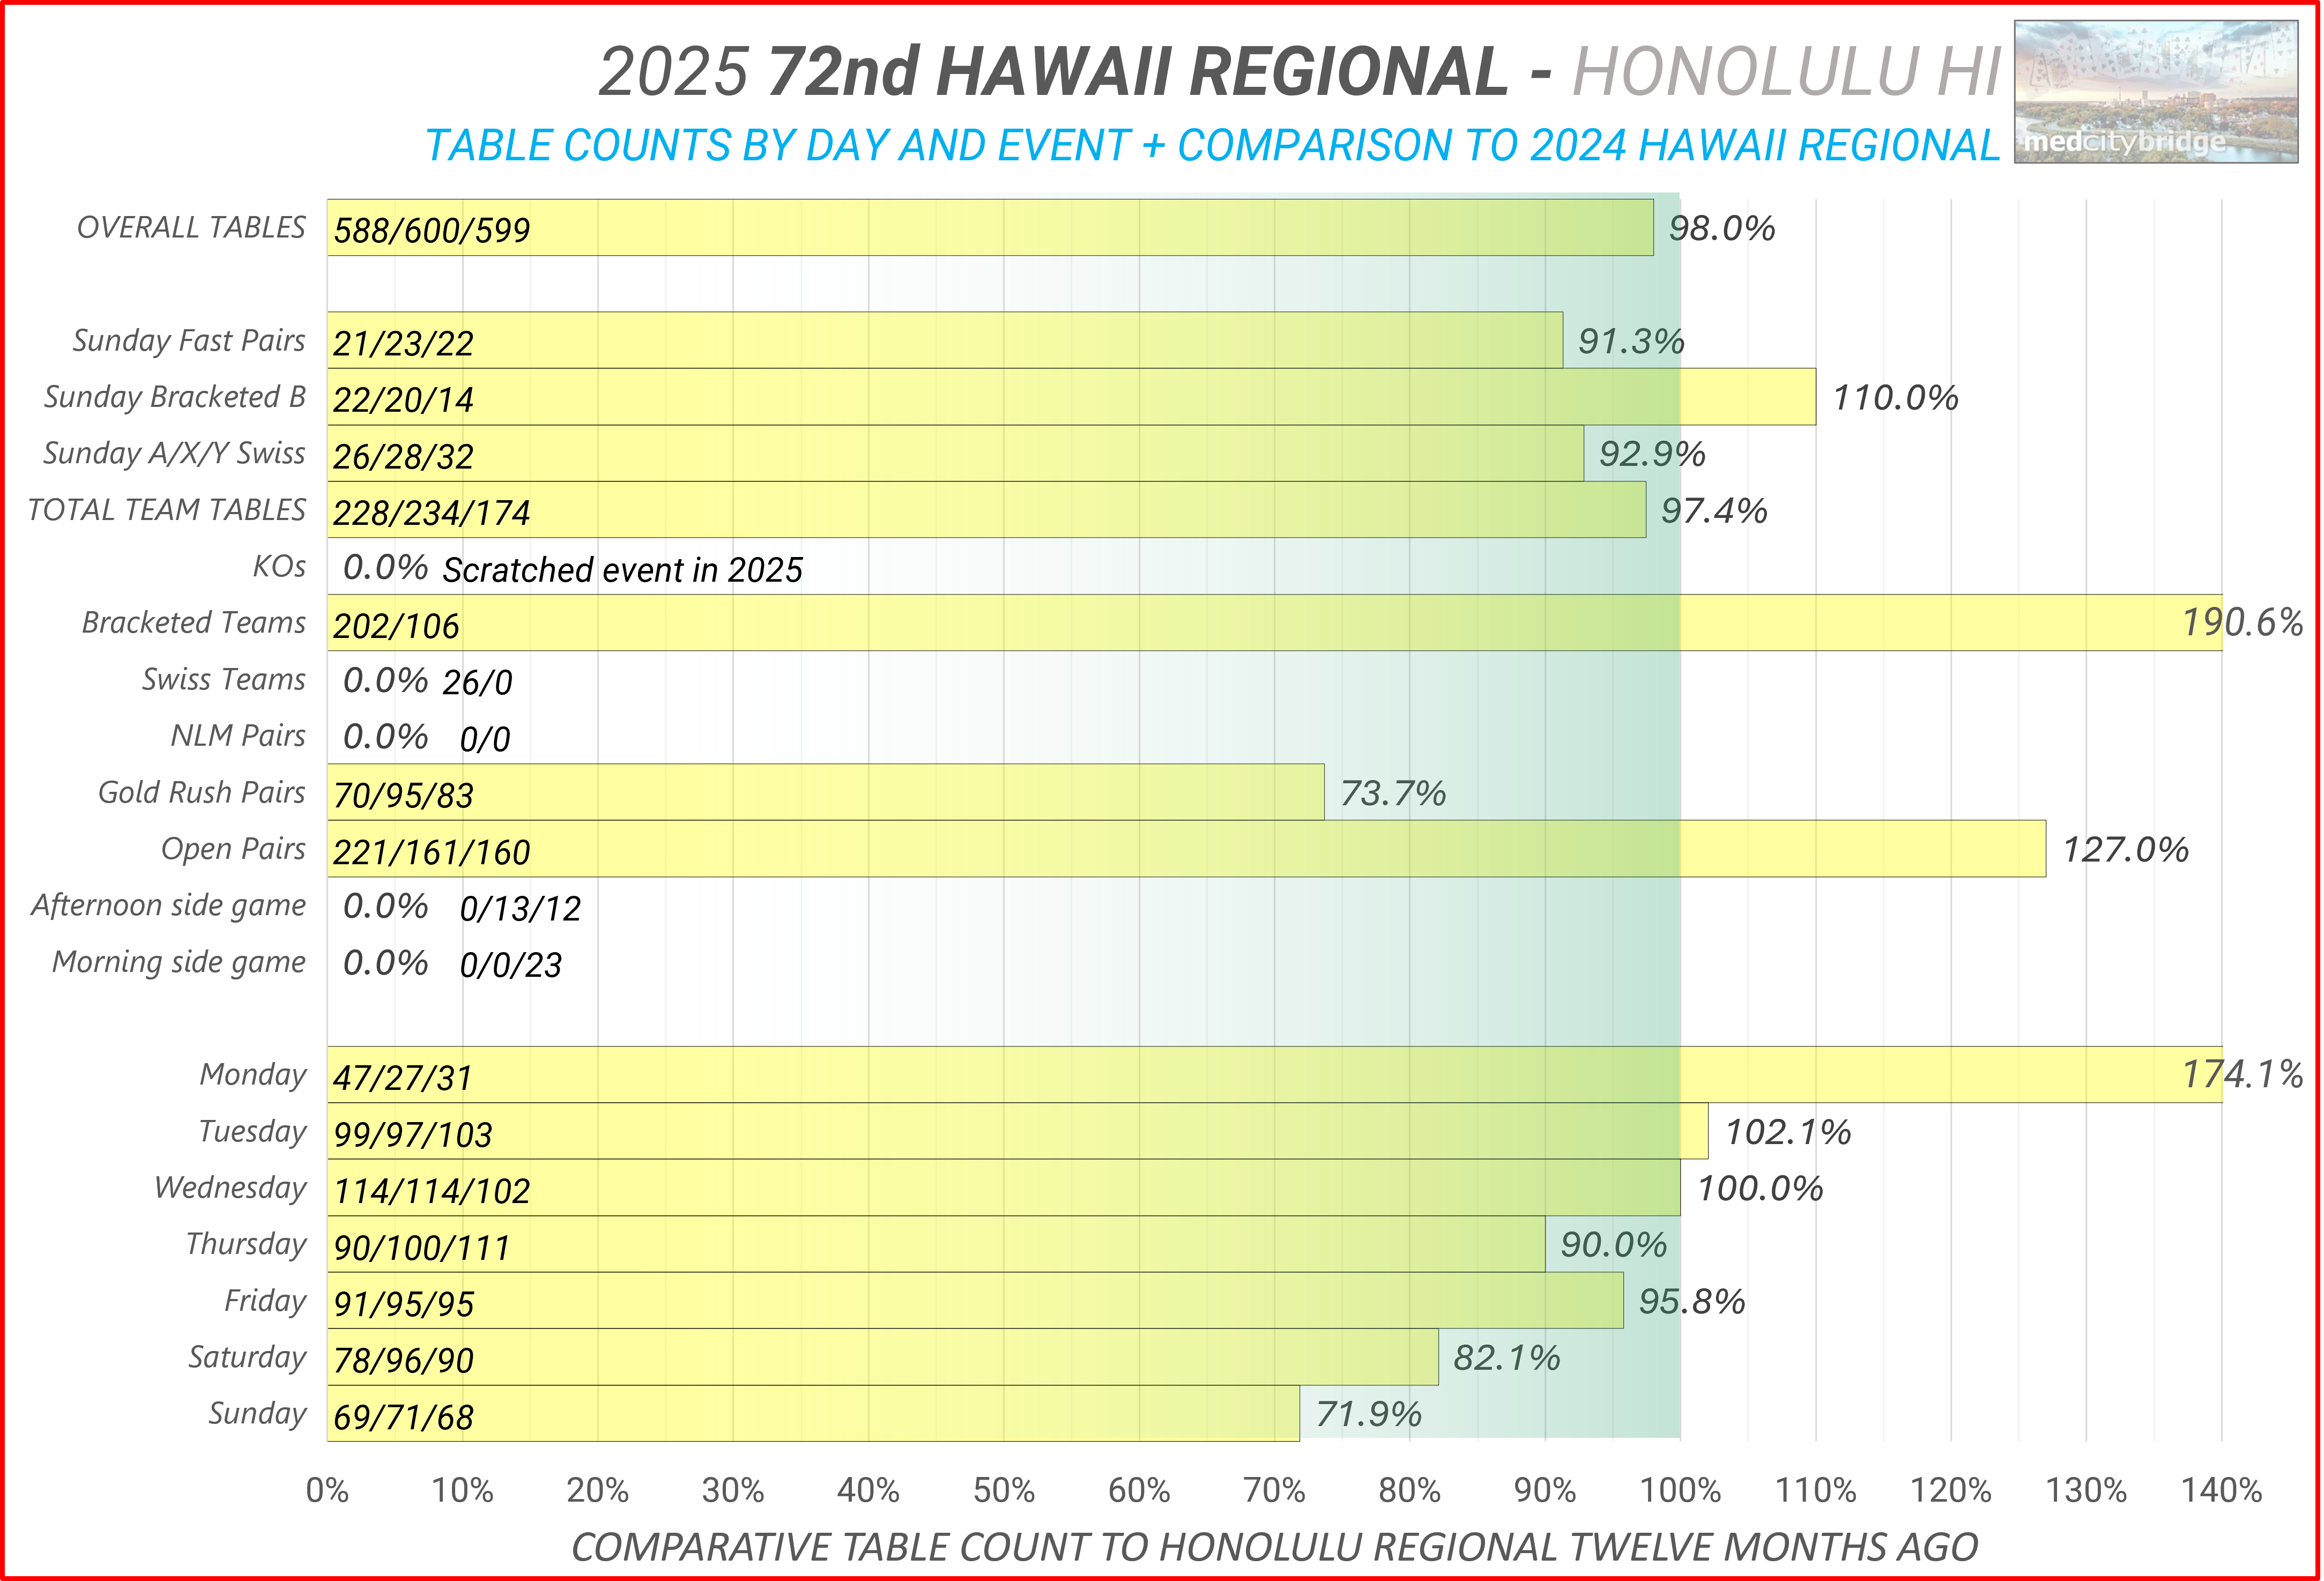
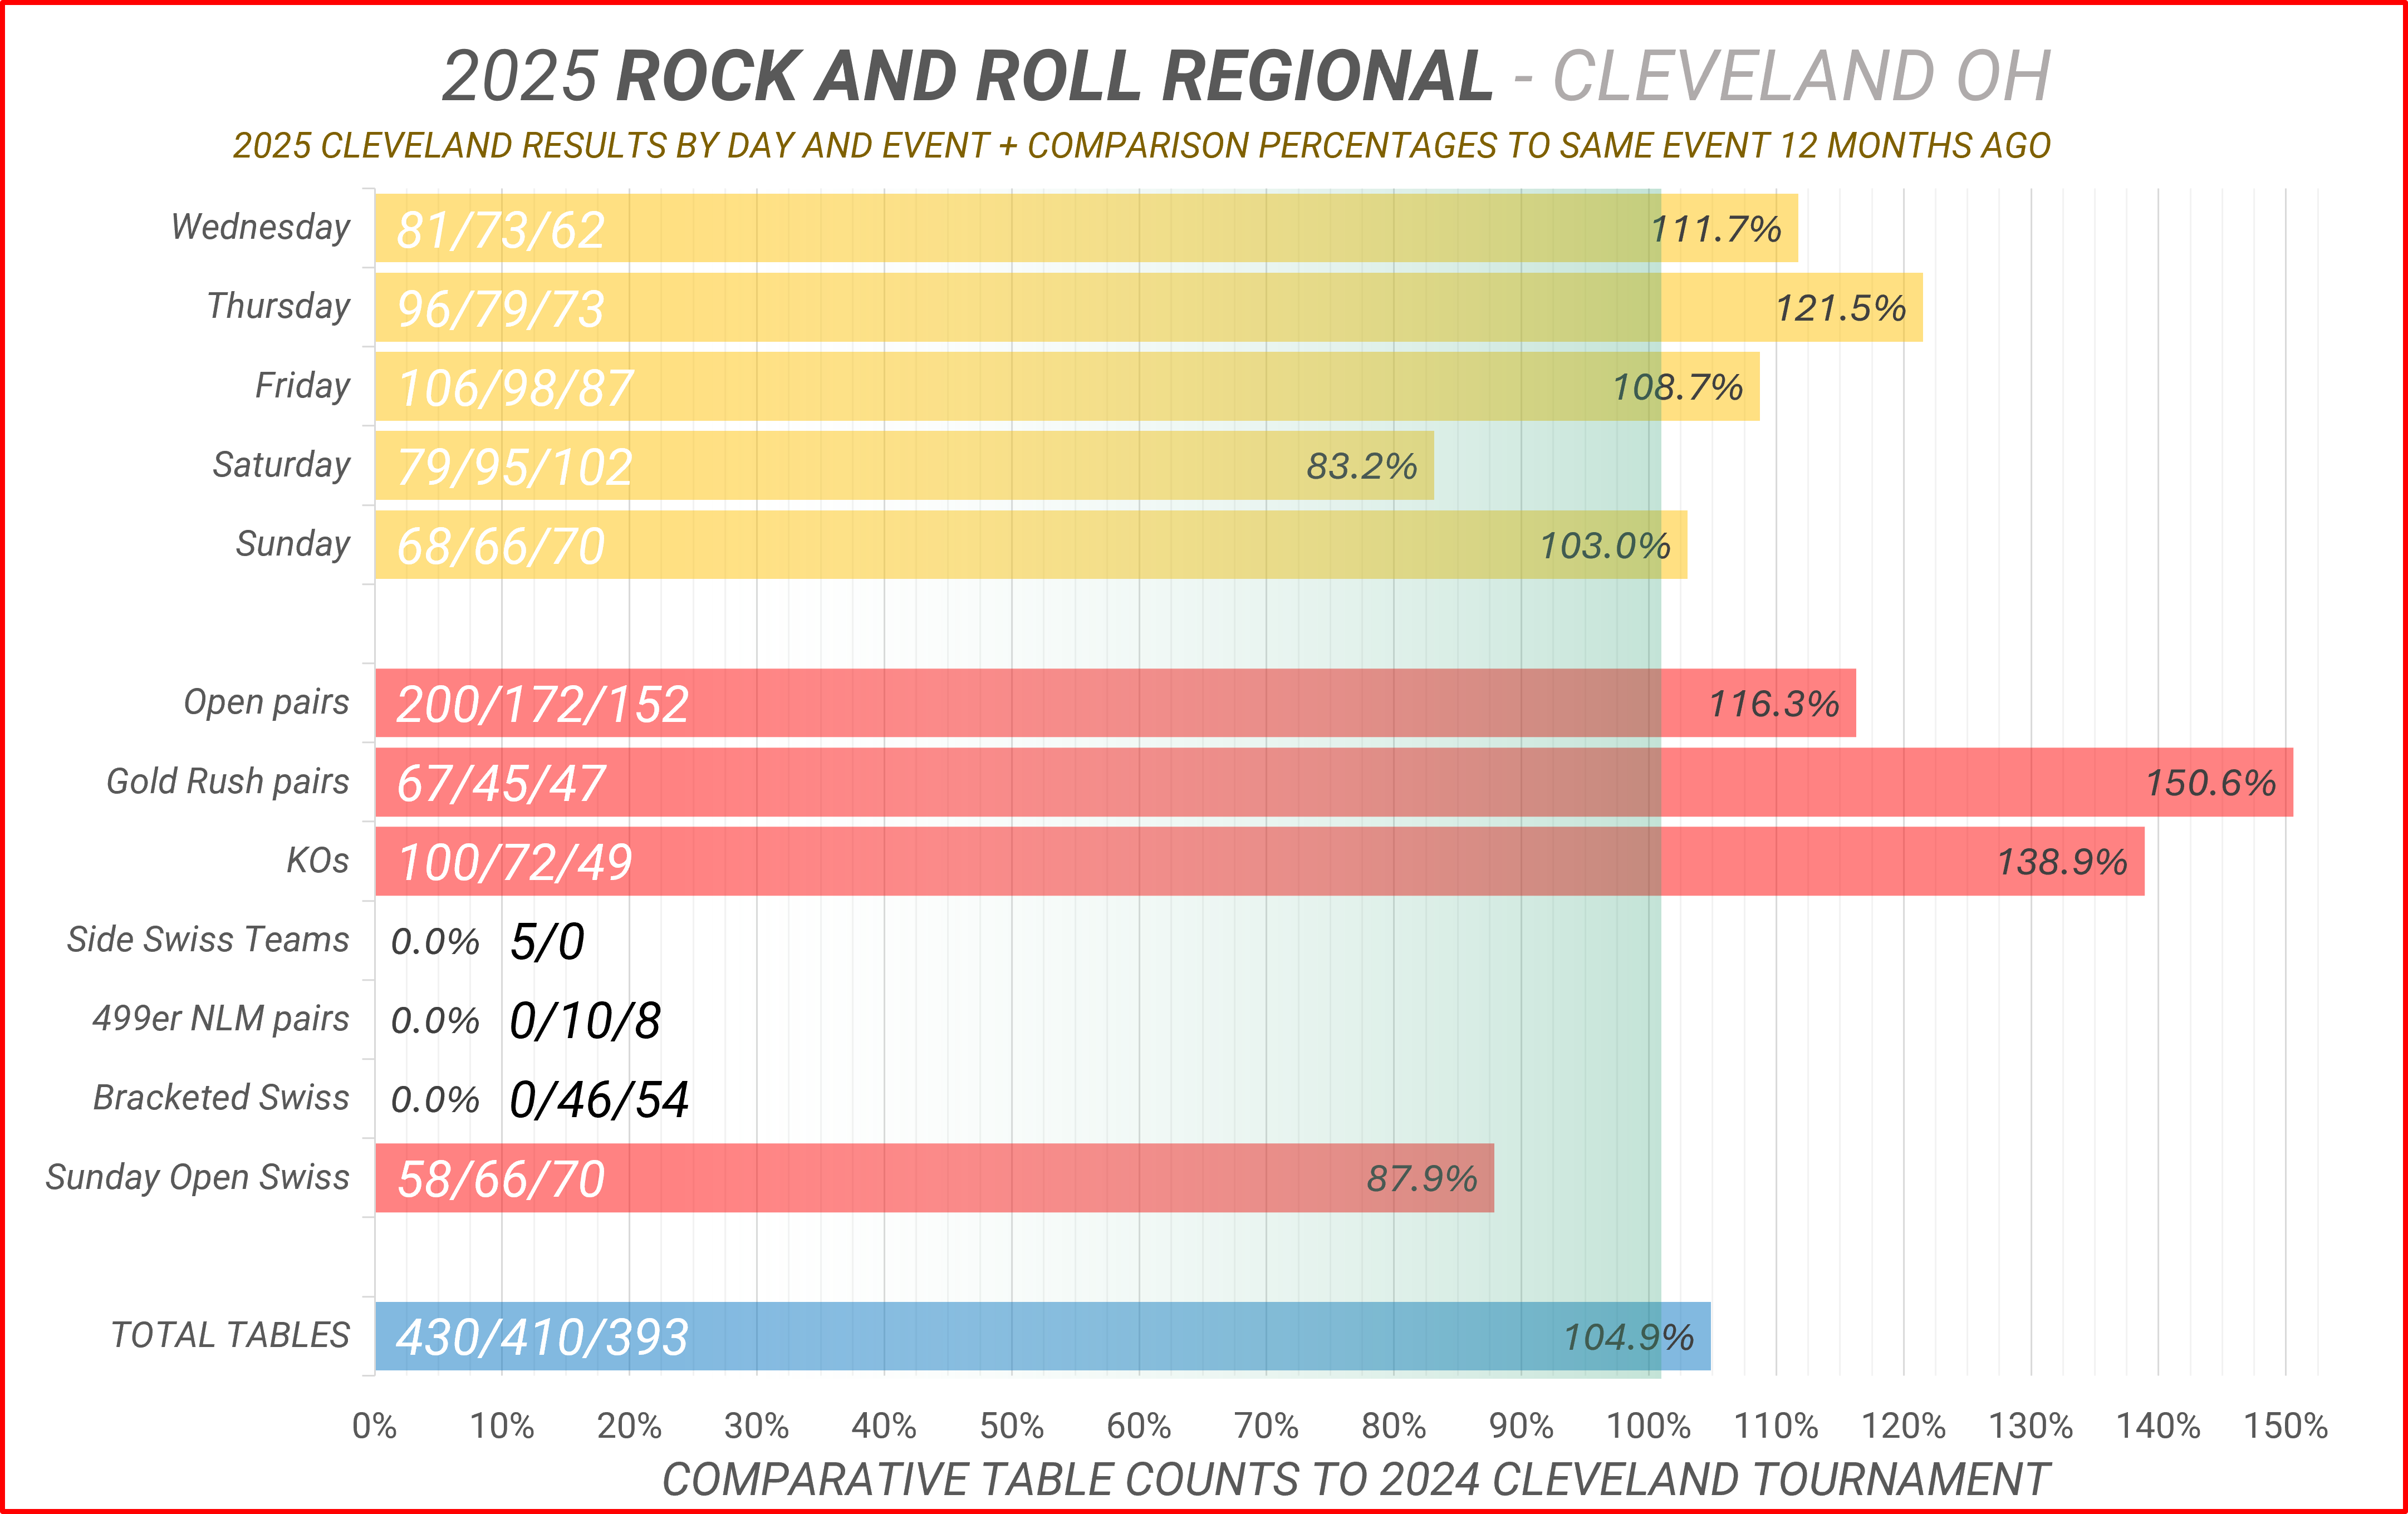
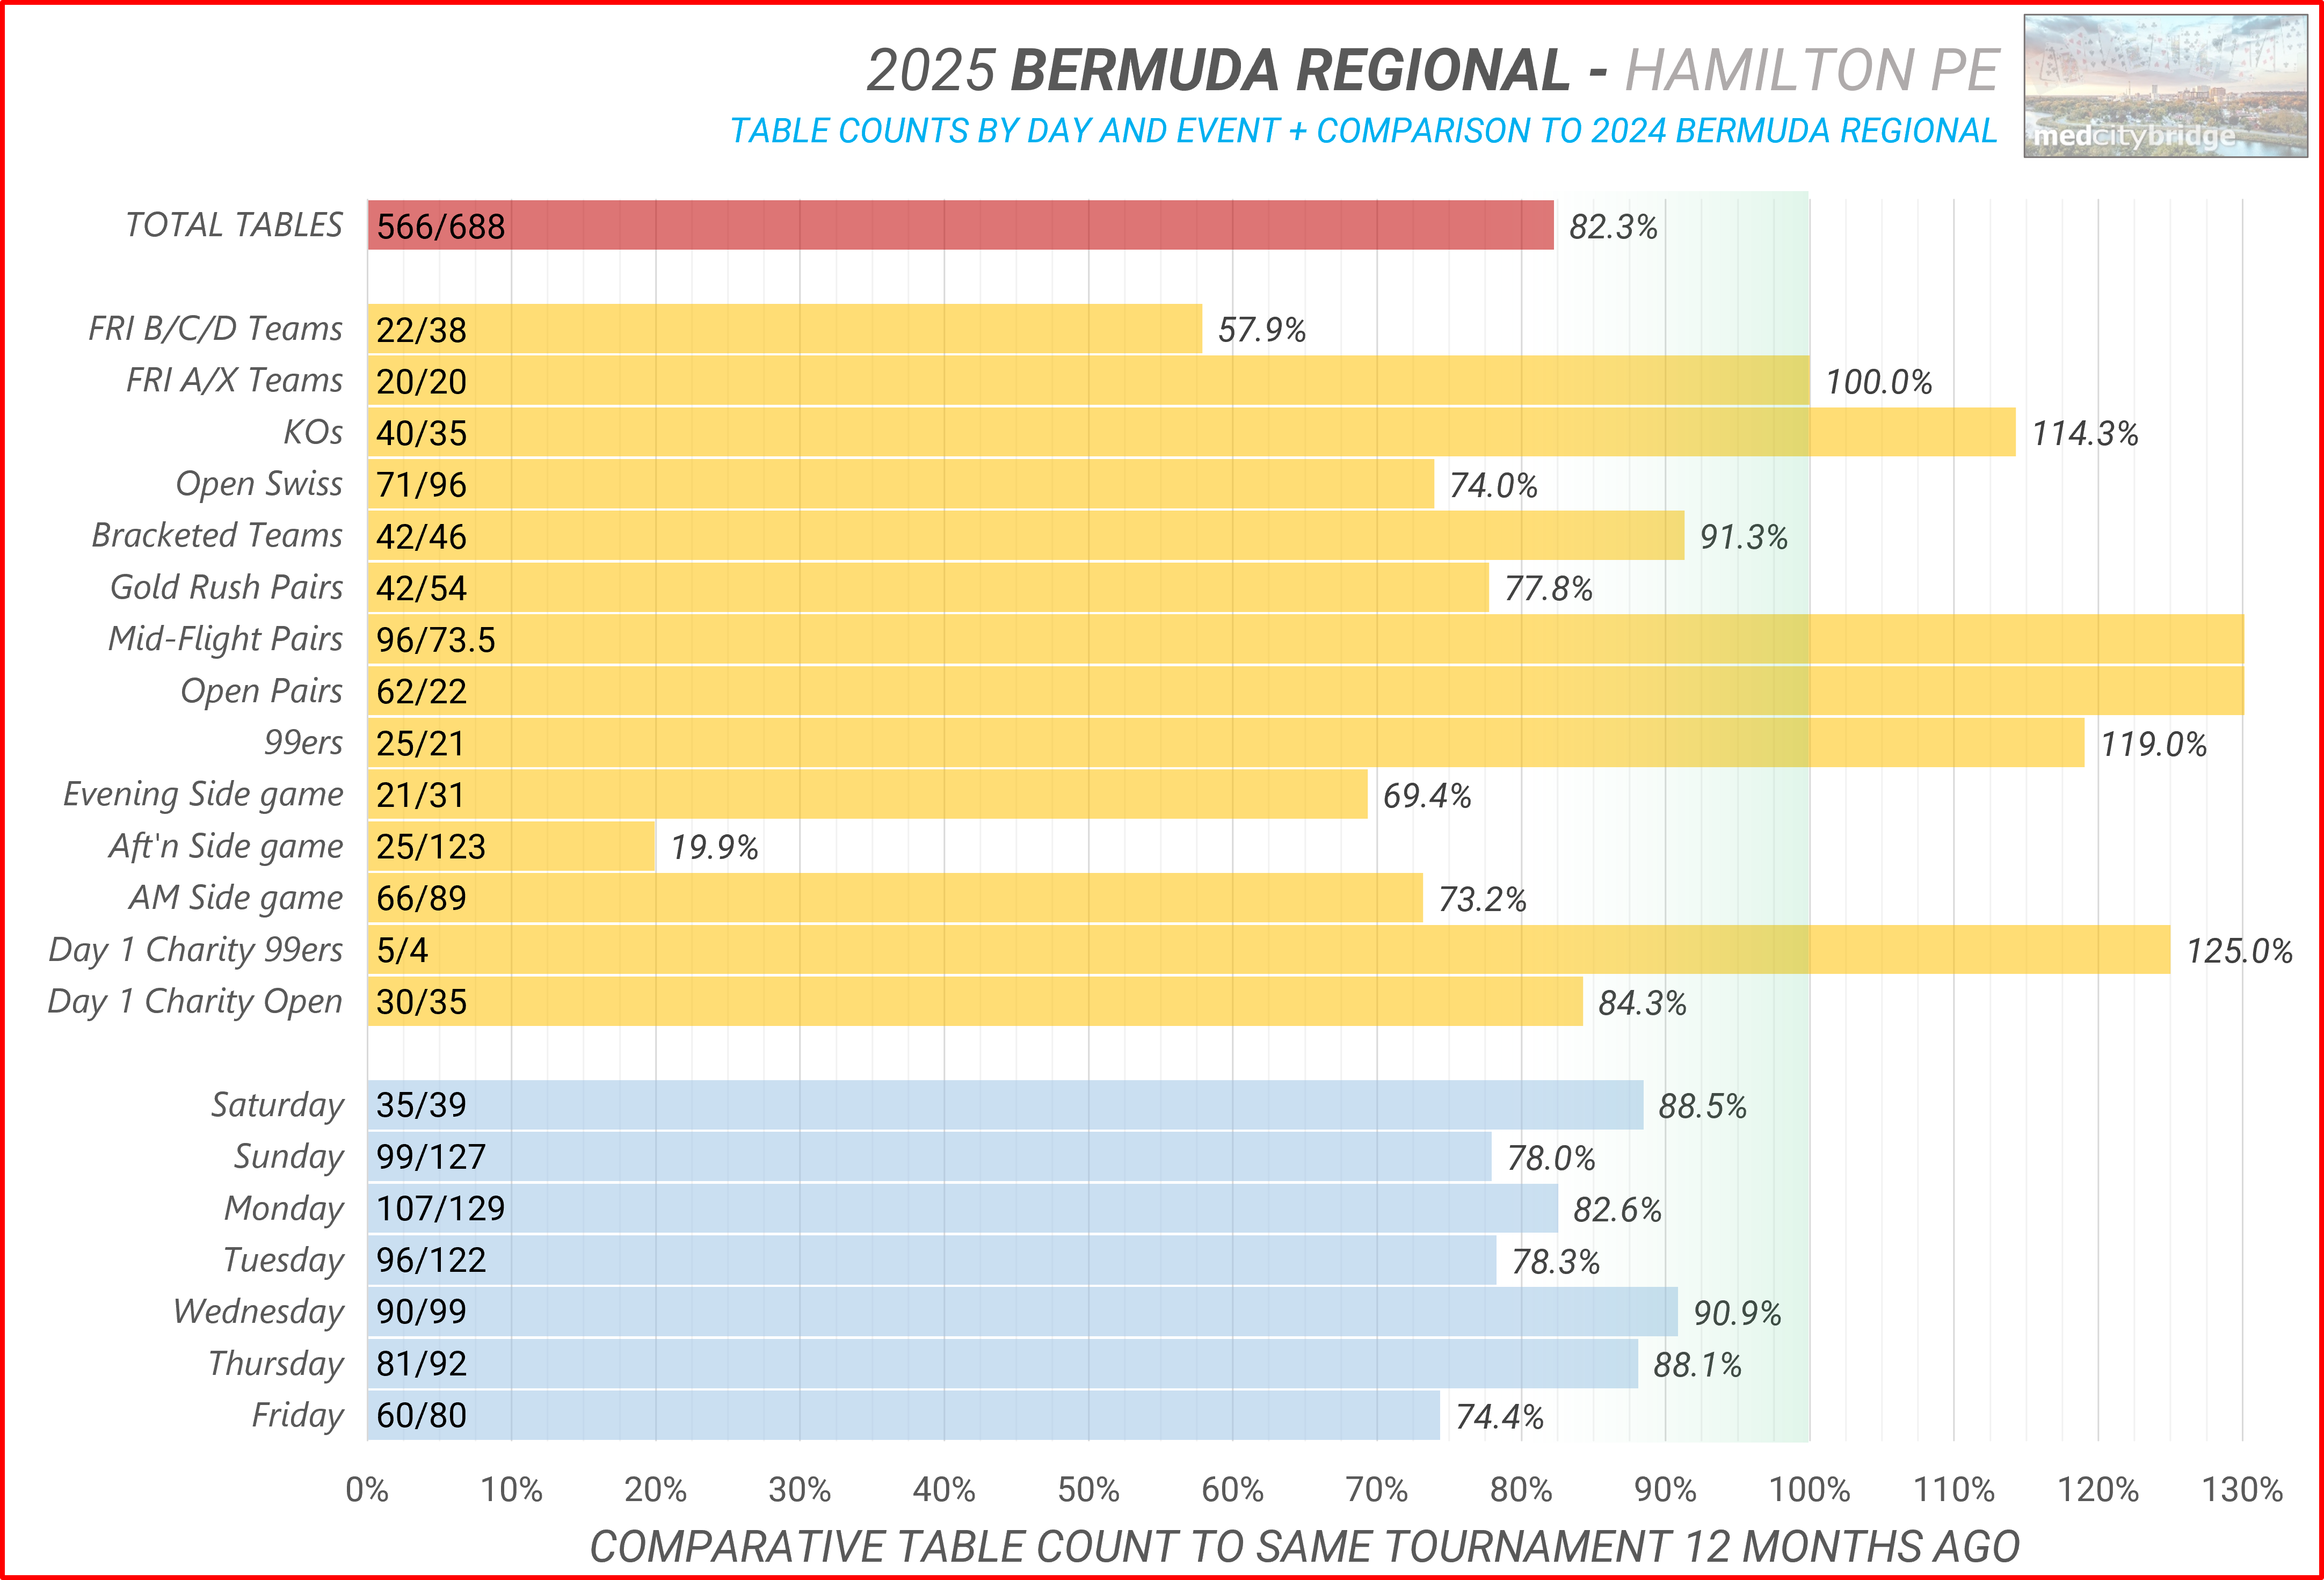
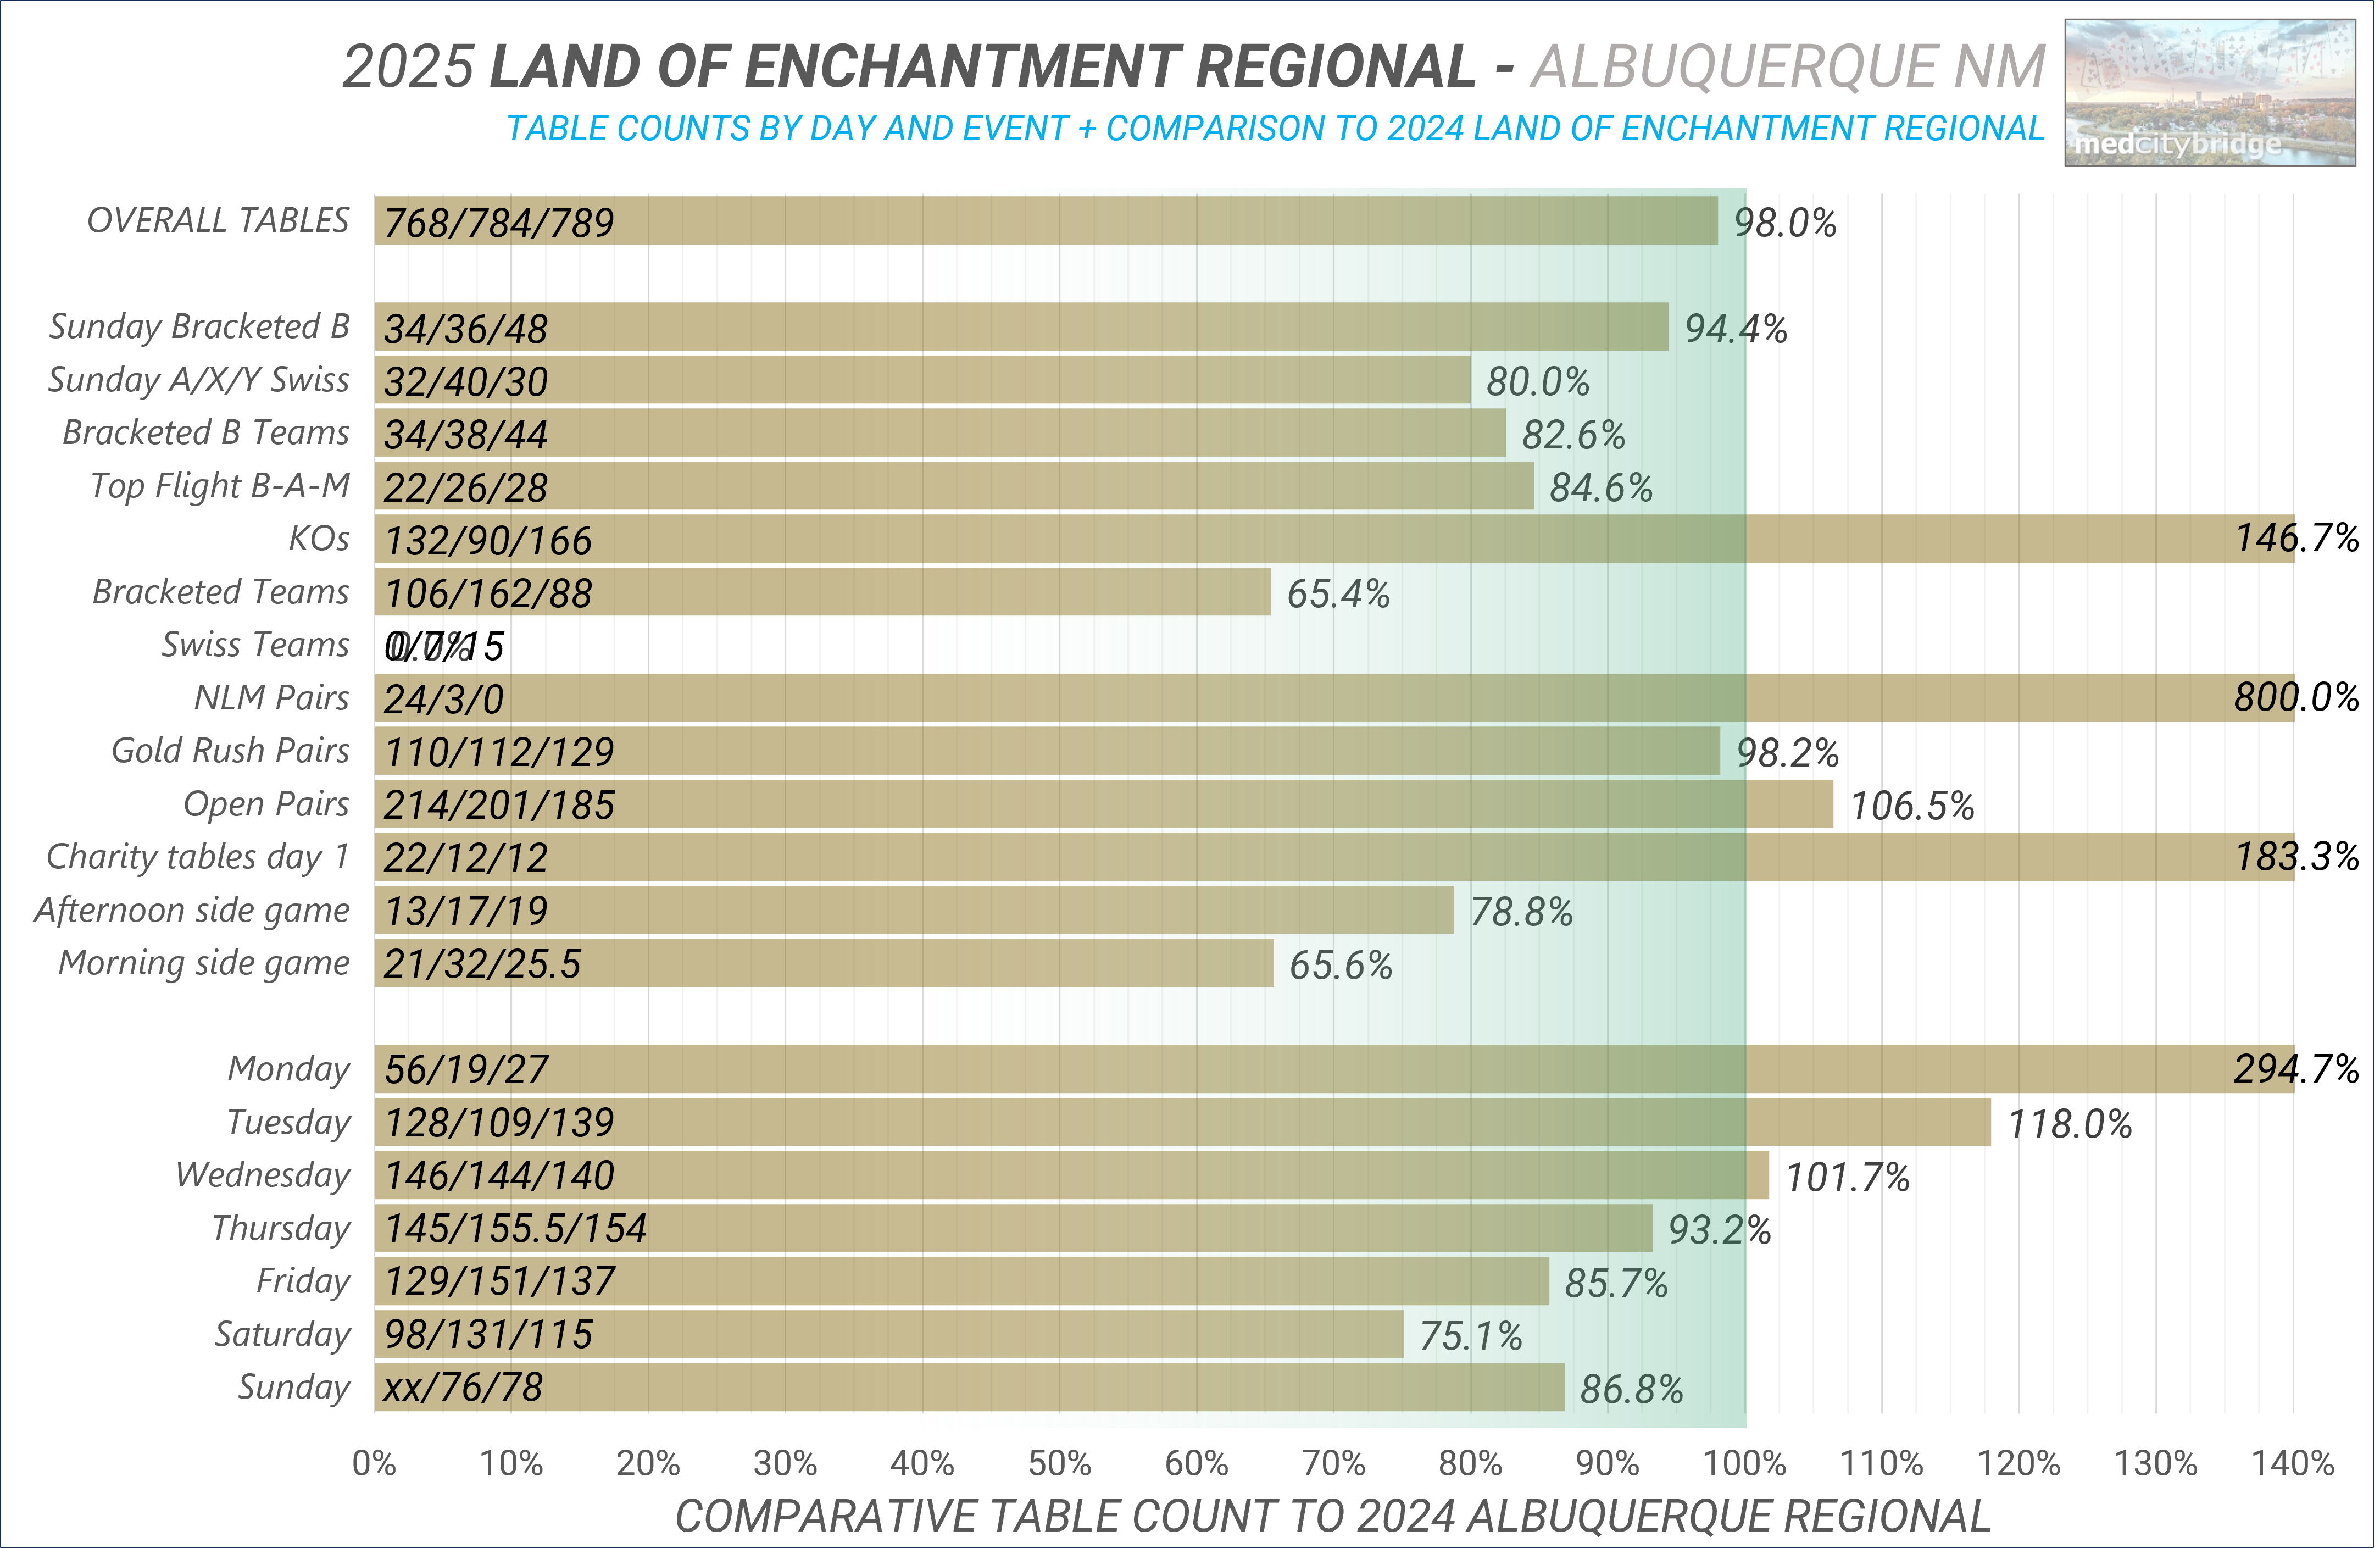
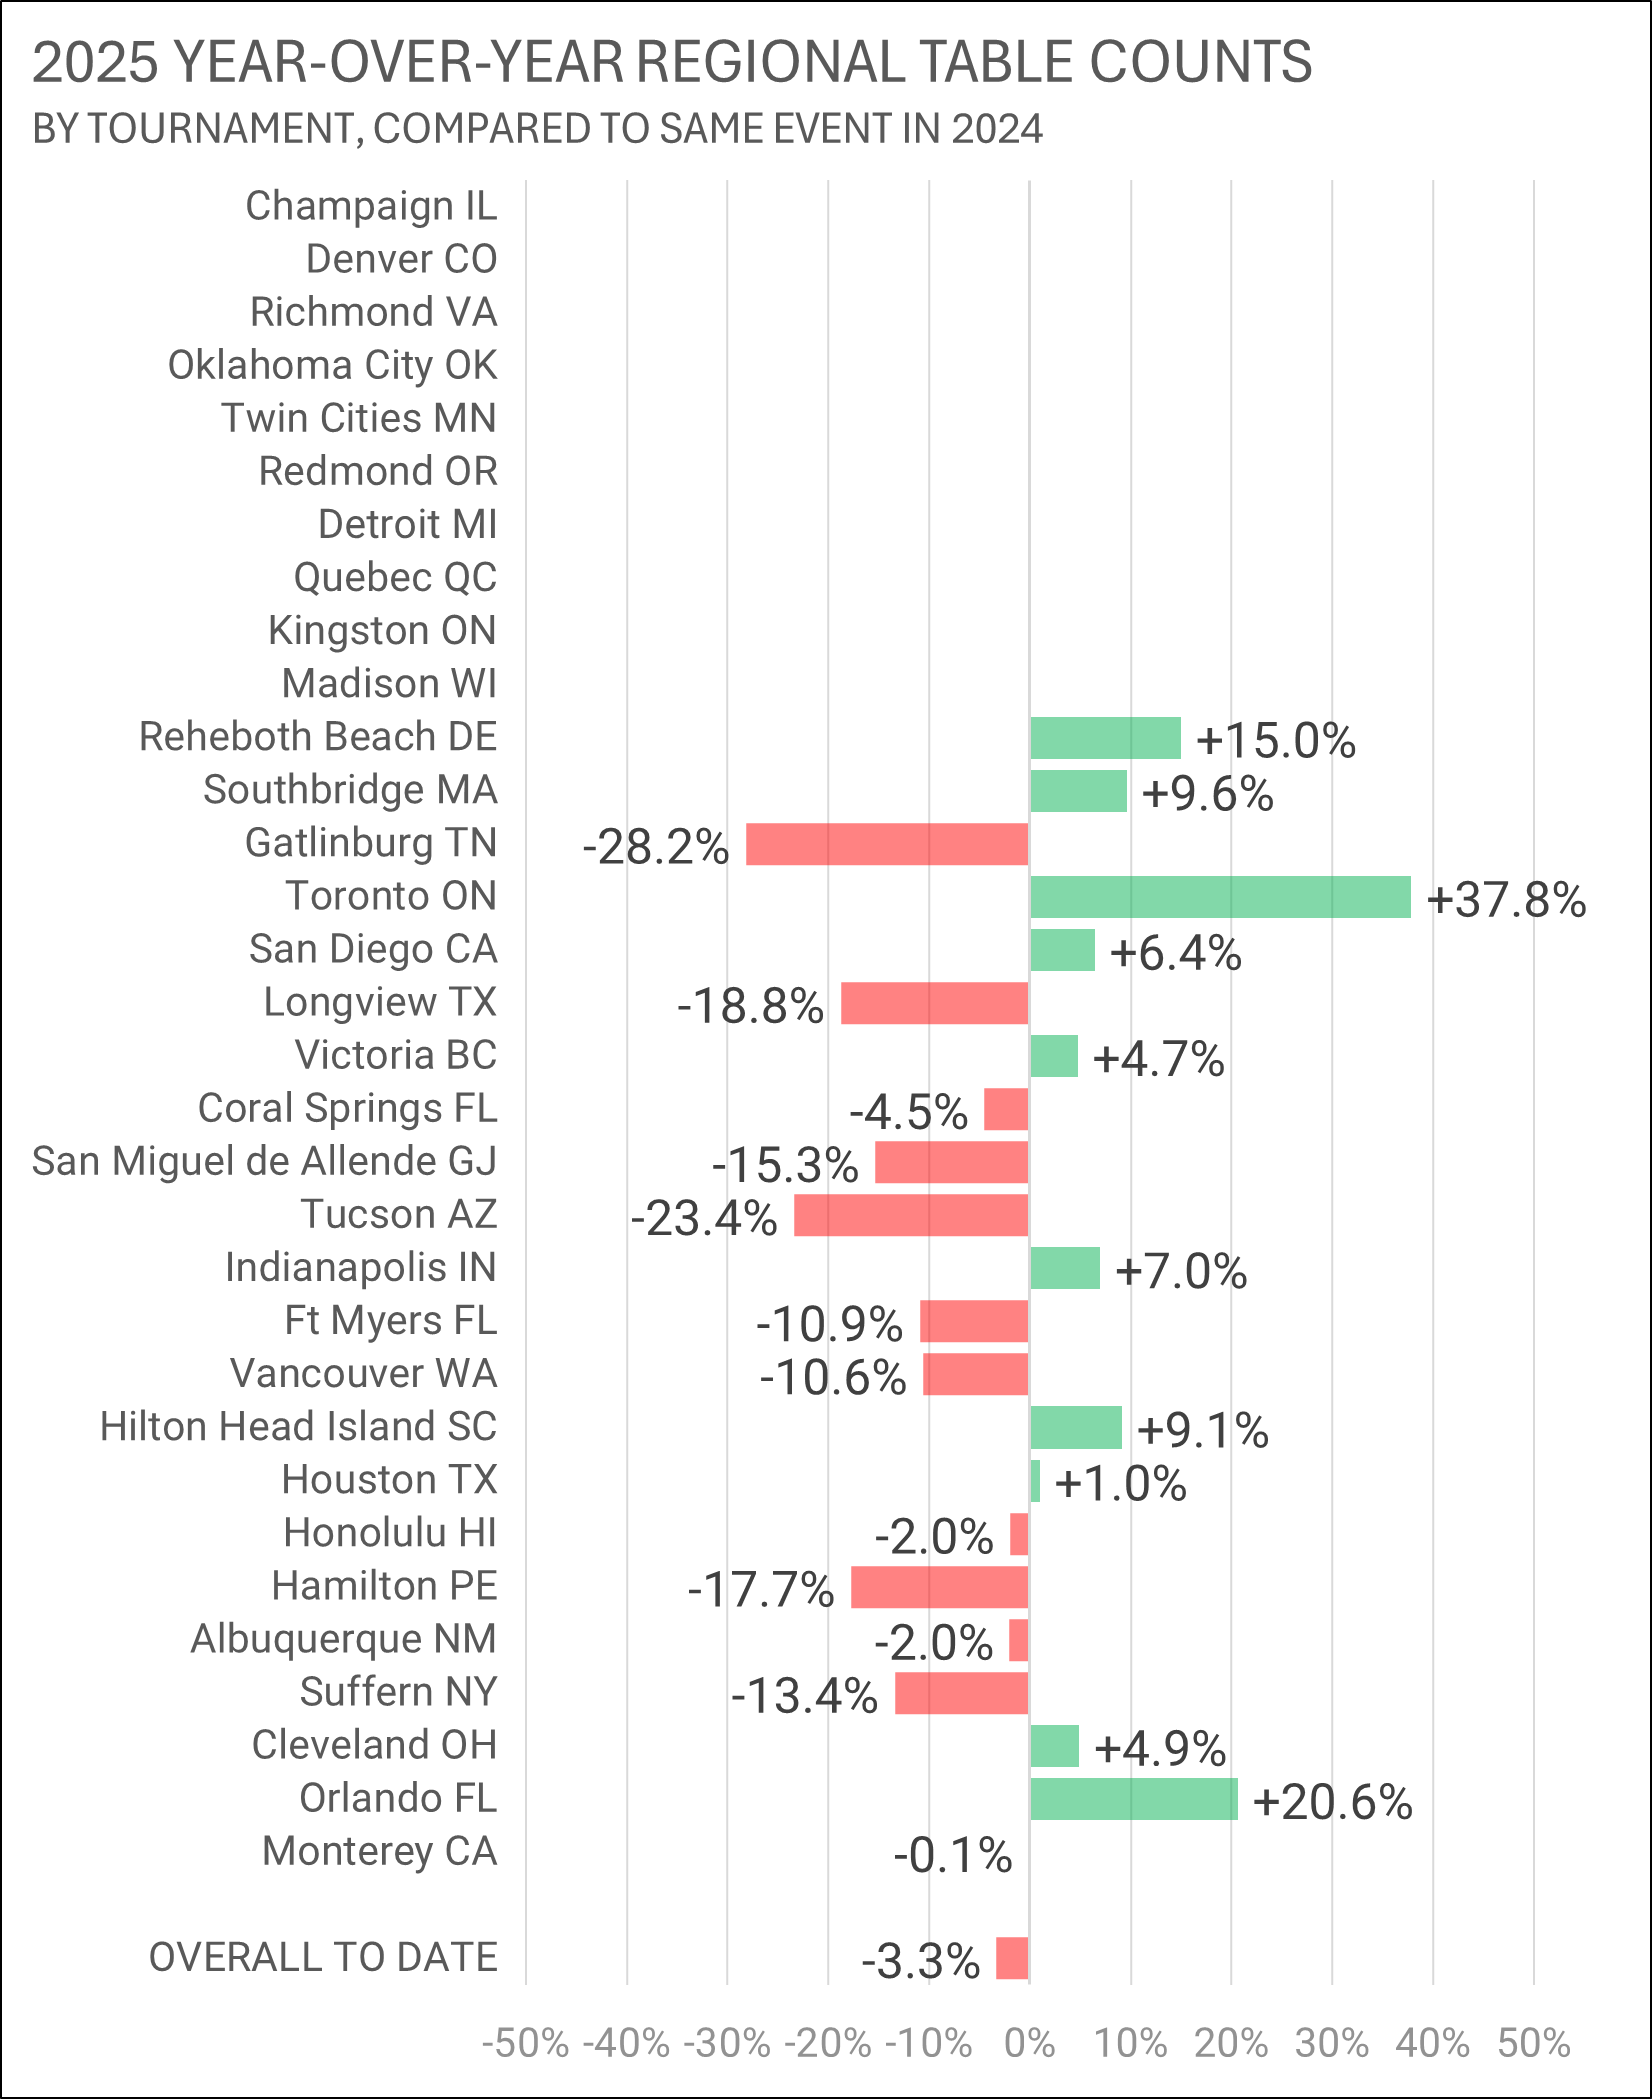
Here's Open repeat-event regionals, with total tables compared to the same event 12 months ago*.  There are a few 2025 regional tournaments not listed here, as they either weren't run the past couple of years or are first-timers, etc., but every regional listed to the left is a direct 2025 to 2024 *(or 2023, if not run last year) comparison.  These comparitive percentages are apples-to-apples.

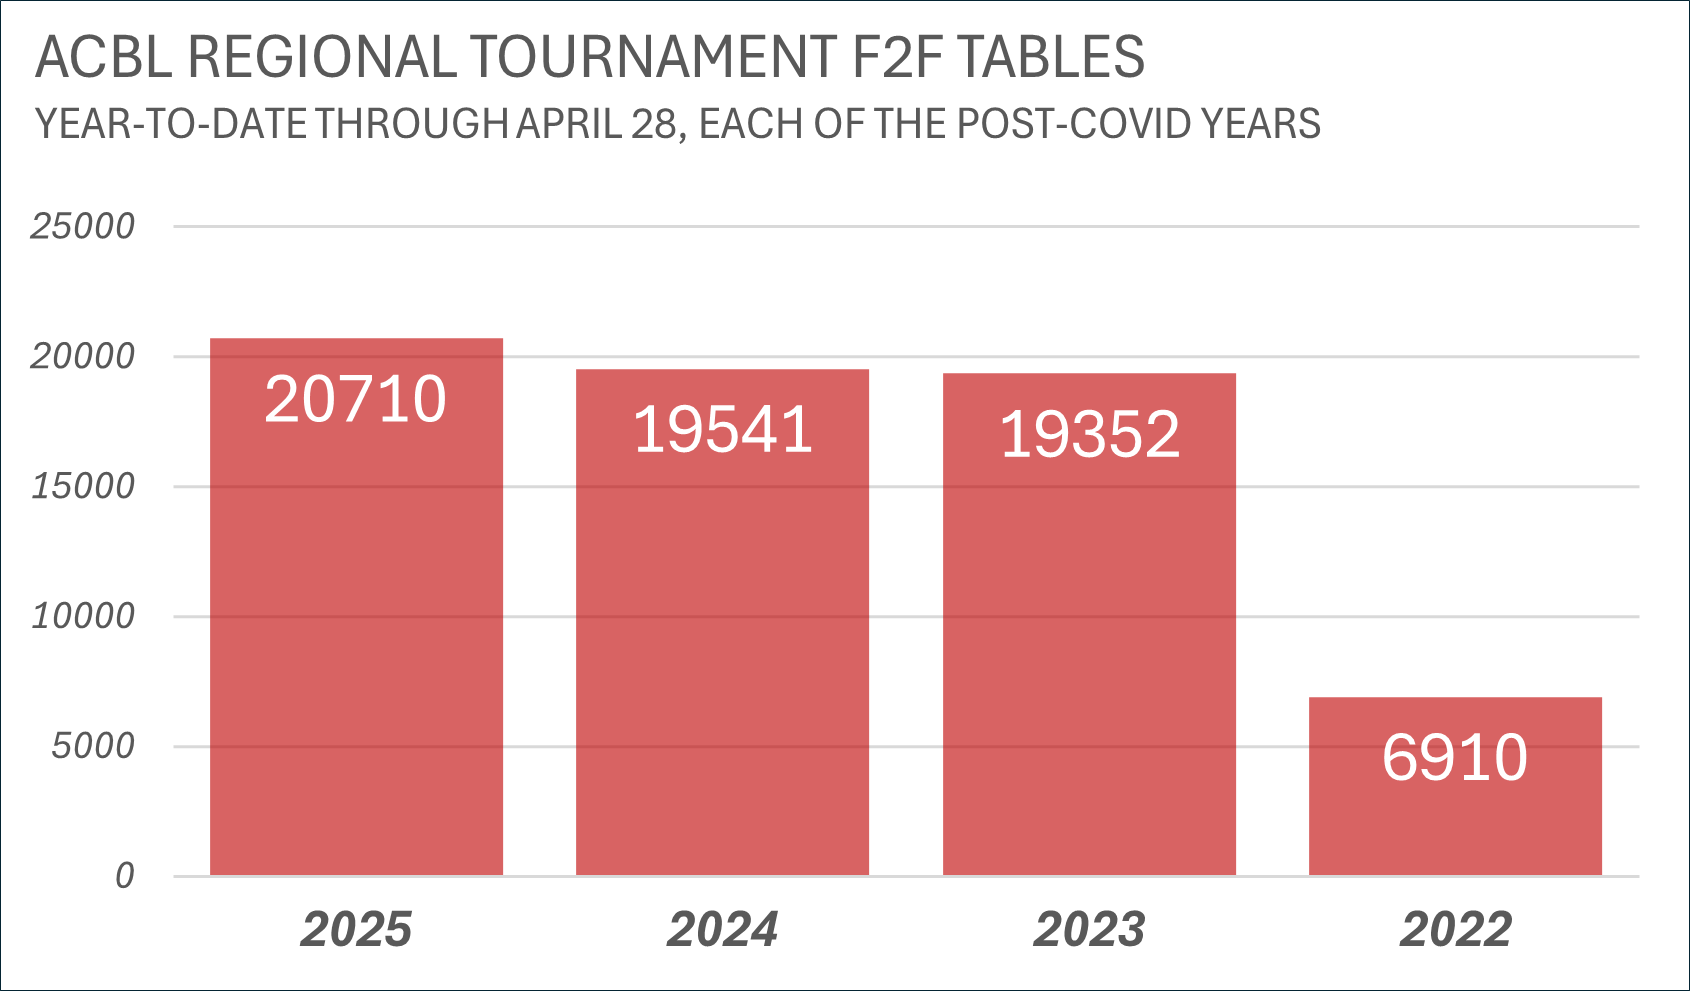
Overall total tables for the year-to-date are up +6.0%, however these same-event total tables are off -3.3% as of May 4 2025, due almost entirely to the massive year-over-year dropoff at Gatlinburg TN in April.

Year-To-Date Open Regional total tables.  This includes all Open Regional tables through April 28 2025, including first-timers and those not held for several years.  It's every table at the Open Regional level.  More tables are in play this year than last, however, same-tournament tables are down slightly (see the chart above).

Intermediate/Newcomer Sectionals this year.  This is where the growth is!  To your left is a chart of the average tables per session for I/N Sectionals in 2025.  Most of these tournaments are running 10 tables per session or less (which isn't terrible), but a few are really impressing.  The 17.3 tables per session was for a one-day NLM tournament in Sauk Rapids, MN, area population of 161,000 (16.6% population is 65+) - that's almost as many tables per session as Palm Desert CA (population 374,000, where there's a much higher percentage of retirees [33.8% population is 65+]).

As of April 2023, the ACBL allowed an online event during your Regional (limited to the district host's players).  But just as online tables in the E-clubs have crumbled in the past two years, online tables in these events have fallen sharply just in the past 12 months - and across all tournaments.  A look at BBO online tables that are associated with face-to-face Regional tournaments, some tournaments are now struggling to get to the "break even" point financially with an online option (13 online tables or more).  That could accelerate this online option's decline even faster.  The chart to your left includes the online tables for regional tournaments held in both 2024 and 2025.


Weekly ACBL club tables, since the post-COVID re-opening through March 31 2025.


Quarterly ACBL club tables, since the post-COVID re-opening through March 31 2025.

2025 OPEN REGIONALS + COMPARISON TO SAME TOURNAMENT IN 2024


CHAMPAIGN IL

DENVER CO

RICHMOND VA

EDMOND OK

TWIN CITIES MN


REDMOND OR


DETROIT MI

KINGSTON ON

MADISON WI

REHEBOTH BEACH DE


VICTORIA B C

GATLINBURG TN

SOUTHBRIDGE MA

TORONTO ON


SAN DIEGO CA

LONGVIEW TX

CORAL SPRINGS FL

SAN MIGUEL MX

TUCSON AZ

FT MYERS FL

HILTON HEAD SC

INDIANAPOLIS IN


VANCOUVER WA

SUFFOLK NY

ORLANDO FL

MONTEREY CA

HOUSTON TX

HONOLULU HI


CLEVELAND OH

BERMUDA

ALBUQUERQUE NM